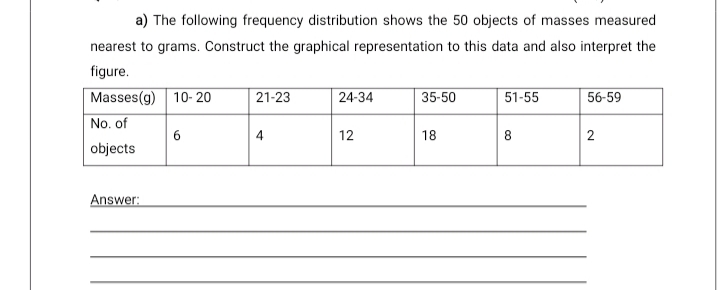
a) The following frequency distribution shows the 50 objects of masses measured nearest to grams. Construct the graphical representation to this data and also interpret the figure.
a) The following frequency distribution shows the 50 objects of masses measured nearest to grams. Construct the graphical representation to this data and also interpret the figure.

Elementary Geometry For College Students, 7e
7th Edition
ISBN:9781337614085
Author:Alexander, Daniel C.; Koeberlein, Geralyn M.
Publisher:Alexander, Daniel C.; Koeberlein, Geralyn M.
Chapter5: Similar Triangles
Section5.4: The Pythagorean Theorem
Problem 2E: Use theorem 5.4.2 to form a proportion in which SV is a geometric mean. Hint: SVTRVS Exercises 1-6

Related questions
Question
Transcribed Image Text:a) The following frequency distribution shows the 50 objects of masses measured
nearest to grams. Construct the graphical representation to this data and also interpret the
figure.
Expert Solution
This question has been solved!
Explore an expertly crafted, step-by-step solution for a thorough understanding of key concepts.

Step by step
Solved in 2 steps with 1 images

Knowledge Booster


Learn more about
Need a deep-dive on the concept behind this application? Look no further. Learn more about this topic, statistics and related others by exploring similar questions and additional content below.Recommended textbooks for you
Elementary Geometry For College Students, 7e
Geometry
ISBN:
9781337614085
Author:
Alexander, Daniel C.; Koeberlein, Geralyn M.
Publisher:
Cengage,

Glencoe Algebra 1, Student Edition, 9780079039897…
Algebra
ISBN:
9780079039897
Author:
Carter
Publisher:
McGraw Hill

Mathematics For Machine Technology
Advanced Math
ISBN:
9781337798310
Author:
Peterson, John.
Publisher:
Cengage Learning,
Elementary Geometry For College Students, 7e
Geometry
ISBN:
9781337614085
Author:
Alexander, Daniel C.; Koeberlein, Geralyn M.
Publisher:
Cengage,
Glencoe Algebra 1, Student Edition, 9780079039897…
Algebra
ISBN:
9780079039897
Author:
Carter
Publisher:
McGraw Hill
Mathematics For Machine Technology
Advanced Math
ISBN:
9781337798310
Author:
Peterson, John.
Publisher:
Cengage Learning,