I A Perform the test of hypotheses indicated, using the data from independent samples given. Use the critical value approach. Compute the p-value of the test, as well. a. Test Ho : H1 - Hz = 0 vs. Ha : H - H2 # 0@a=0.01 -46, 81 n1 = 125, 1 = = 10 90, 2 = -50, s2 n2 = = 13 b. Test Ho : H1 - Hz n1 = 40, T1 = 142, s1 = 11 118. s2 = 20 vs. Ha : H - Hz > 20@a= 0.05: n2 = 40, 2 = = 10 itica
I A Perform the test of hypotheses indicated, using the data from independent samples given. Use the critical value approach. Compute the p-value of the test, as well. a. Test Ho : H1 - Hz = 0 vs. Ha : H - H2 # 0@a=0.01 -46, 81 n1 = 125, 1 = = 10 90, 2 = -50, s2 n2 = = 13 b. Test Ho : H1 - Hz n1 = 40, T1 = 142, s1 = 11 118. s2 = 20 vs. Ha : H - Hz > 20@a= 0.05: n2 = 40, 2 = = 10 itica

MATLAB: An Introduction with Applications
6th Edition
ISBN:9781119256830
Author:Amos Gilat
Publisher:Amos Gilat
Chapter1: Starting With Matlab
Section: Chapter Questions
Problem 1P

Related questions
Question
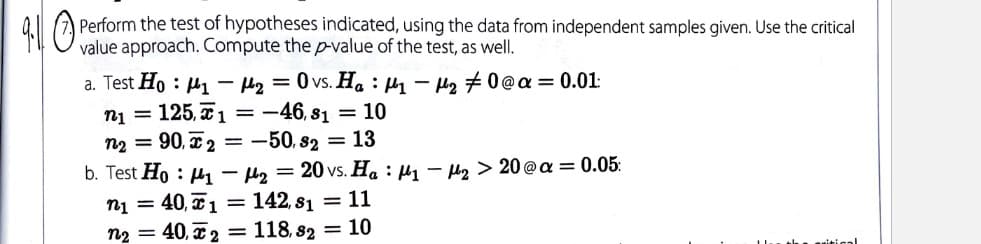
Transcribed Image Text:Perform the test of hypotheses indicated, using the data from independent samples given. Use the critical
value approach. Compute the p-value of the test, as well.
a. Test Ho : µ1 – Hg = 0 vs. Ha : H1 - H2 # 0 @a = 0.01:
ni = 125, 1 =-46, 81 = 10
n2 = 90, x 2 = -50, 82 = 13
b. Test Ho : H1 – Hz = 20 vs. Ha : µ1 – H2 > 20@a = 0.05:
ni = 40, x1 = 142, s1 = 11
40, x2 = 118, s2 = 10
n2
the ariticalI
Expert Solution
This question has been solved!
Explore an expertly crafted, step-by-step solution for a thorough understanding of key concepts.

This is a popular solution!

Trending now
This is a popular solution!

Step by step
Solved in 4 steps with 3 images

Recommended textbooks for you
MATLAB: An Introduction with Applications
Statistics
ISBN:
9781119256830
Author:
Amos Gilat
Publisher:
John Wiley & Sons Inc

Probability and Statistics for Engineering and th…
Statistics
ISBN:
9781305251809
Author:
Jay L. Devore
Publisher:
Cengage Learning

Statistics for The Behavioral Sciences (MindTap C…
Statistics
ISBN:
9781305504912
Author:
Frederick J Gravetter, Larry B. Wallnau
Publisher:
Cengage Learning
MATLAB: An Introduction with Applications
Statistics
ISBN:
9781119256830
Author:
Amos Gilat
Publisher:
John Wiley & Sons Inc
Probability and Statistics for Engineering and th…
Statistics
ISBN:
9781305251809
Author:
Jay L. Devore
Publisher:
Cengage Learning
Statistics for The Behavioral Sciences (MindTap C…
Statistics
ISBN:
9781305504912
Author:
Frederick J Gravetter, Larry B. Wallnau
Publisher:
Cengage Learning

Elementary Statistics: Picturing the World (7th E…
Statistics
ISBN:
9780134683416
Author:
Ron Larson, Betsy Farber
Publisher:
PEARSON

The Basic Practice of Statistics
Statistics
ISBN:
9781319042578
Author:
David S. Moore, William I. Notz, Michael A. Fligner
Publisher:
W. H. Freeman

Introduction to the Practice of Statistics
Statistics
ISBN:
9781319013387
Author:
David S. Moore, George P. McCabe, Bruce A. Craig
Publisher:
W. H. Freeman