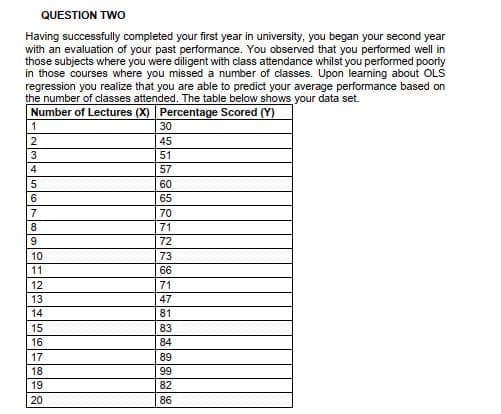
(i) Compute the following x, y, xy, y2, x2, XY, Y2 and X² and your regression intercept and slope. (i) Compute your Y and plot your Sample regression line. (ii) Construct a 95% confidence interval for your slope and intercept. (iv) Assuming the r2 for this regression is 0.89 what is the interpretation of this. Why is it not 100% [give an example in your explanation). (v) Conduct a test to determine if the additional variable improves overall significance at 10% level of significance.


Correlation
Correlation defines a relationship between two independent variables. It tells the degree to which variables move in relation to each other. When two sets of data are related to each other, there is a correlation between them.
Linear Correlation
A correlation is used to determine the relationships between numerical and categorical variables. In other words, it is an indicator of how things are connected to one another. The correlation analysis is the study of how variables are related.
Regression Analysis
Regression analysis is a statistical method in which it estimates the relationship between a dependent variable and one or more independent variable. In simple terms dependent variable is called as outcome variable and independent variable is called as predictors. Regression analysis is one of the methods to find the trends in data. The independent variable used in Regression analysis is named Predictor variable. It offers data of an associated dependent variable regarding a particular outcome.
![(i)
Compute the following x, y, xy, y, x², XY, Y and X2 and your regression
intercept and slope.
(i)
Compute your Yi and plot your Sample regression line.
(ii) Construct a 95% confidence interval for your slope and intercept.
(iv)
Assuming the r? for this regression is 0.89 what is the interpretation of this.
Why is it not 100% [give an example in your explanation].
(v)
Conduct a test to determine if the additional variable improves overall
significance at 10% level of significance.](/v2/_next/image?url=https%3A%2F%2Fcontent.bartleby.com%2Fqna-images%2Fquestion%2F53e787d2-04c2-4def-9236-eb93fec795e1%2F2653f858-2223-4fba-a2e4-aa14c6d48df3%2Fmfesa8a_processed.jpeg&w=3840&q=75)


Trending now
This is a popular solution!

Step by step
Solved in 2 steps with 1 images


