I have obtained Target Corporation’s annual report for its 2018 fiscal year (year ended February 2, 2019). What was Target’s accounting equation for 2018?

Financial Accounting: The Impact on Decision Makers
10th Edition
ISBN:9781305654174
Author:Gary A. Porter, Curtis L. Norton
Publisher:Gary A. Porter, Curtis L. Norton
Chapter13: Financial Statement Analysis
Section: Chapter Questions
Problem 13.9E
icon
Related questions
icon
Concept explainers
Topic Video
Question
100%
I have obtained Target Corporation’s annual report for its 2018 fiscal year (year ended February 2, 2019). What was Target’s accounting equation for 2018?
financial highlights
financial summary
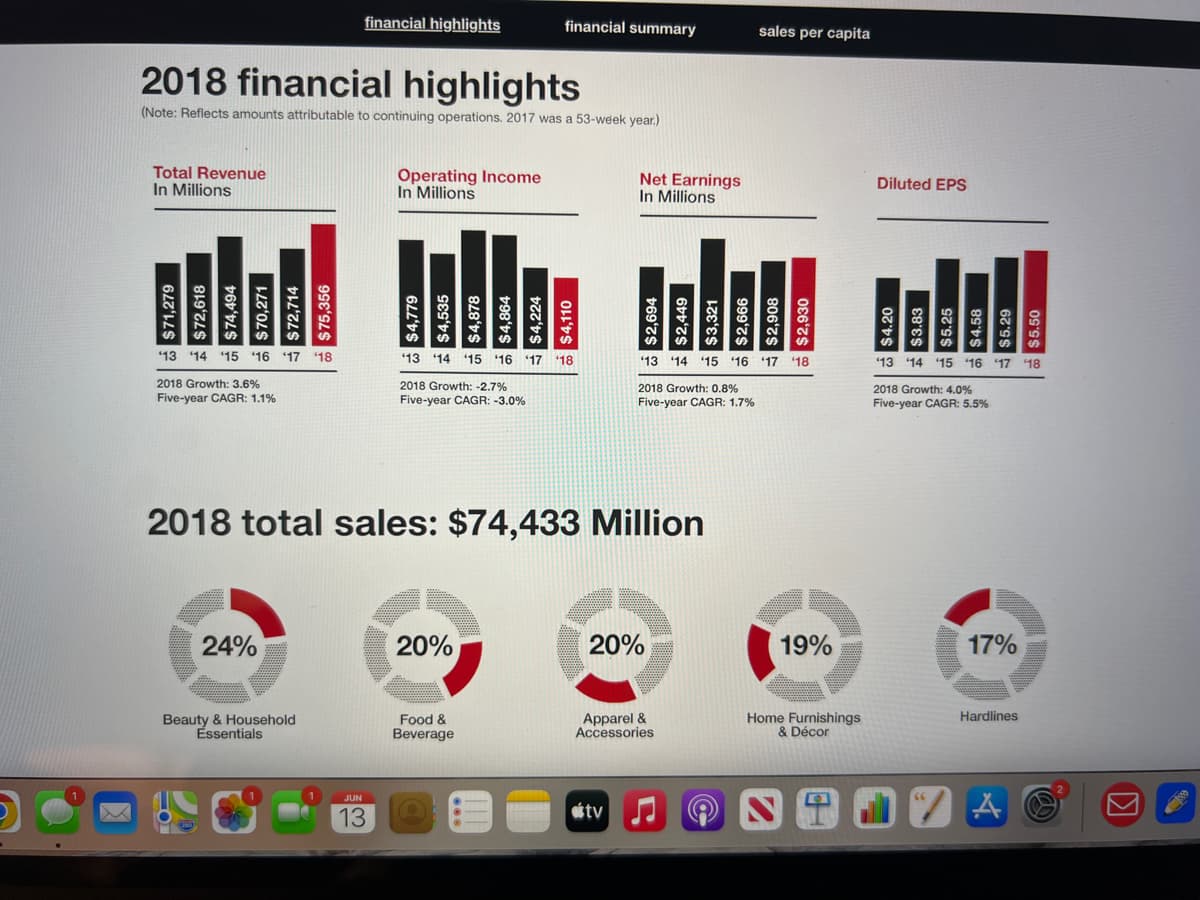
2018 financial highlights
(Note: Reflects amounts attributable to continuing operations. 2017 was a 53-week year.)
Total Revenue
Operating Income
In Millions
In Millions
Net Earnings
In Millions
sales per capita
$71,279
$72,618
$74,494
$70,271
$72,714
$75,356
$4,779
$4,535
$4,878
$4,864
$4,224
$4,110
$2,694
$2,449
$3,321
$2,666
$2,908
$2,930
13
'13 14 15 16 '17 '18
'13 14 '15 16 17 18
13 14 15 16 17 18
2018 Growth: 3.6%
2018 Growth: -2.7%
2018 Growth: 0.8%
Five-year CAGR: 1.1%
Five-year CAGR: -3.0%
Five-year CAGR: 1.7%
2018 total sales: $74,433 Million
24%
20%
20%
Beauty & Household
Essentials
Food &
Beverage
Apparel &
Accessories
tv
19%
Home Furnishings
& Décor
Diluted EPS
%252
'13 14 15 16 17 18
2018 Growth: 4.0%
Five-year CAGR: 5.5%
17%
Hardlines
A
Transcribed Image Text:financial highlights financial summary 2018 financial highlights (Note: Reflects amounts attributable to continuing operations. 2017 was a 53-week year.) Total Revenue Operating Income In Millions In Millions Net Earnings In Millions sales per capita $71,279 $72,618 $74,494 $70,271 $72,714 $75,356 $4,779 $4,535 $4,878 $4,864 $4,224 $4,110 $2,694 $2,449 $3,321 $2,666 $2,908 $2,930 13 '13 14 15 16 '17 '18 '13 14 '15 16 17 18 13 14 15 16 17 18 2018 Growth: 3.6% 2018 Growth: -2.7% 2018 Growth: 0.8% Five-year CAGR: 1.1% Five-year CAGR: -3.0% Five-year CAGR: 1.7% 2018 total sales: $74,433 Million 24% 20% 20% Beauty & Household Essentials Food & Beverage Apparel & Accessories tv 19% Home Furnishings & Décor Diluted EPS %252 '13 14 15 16 17 18 2018 Growth: 4.0% Five-year CAGR: 5.5% 17% Hardlines A
financial highlights
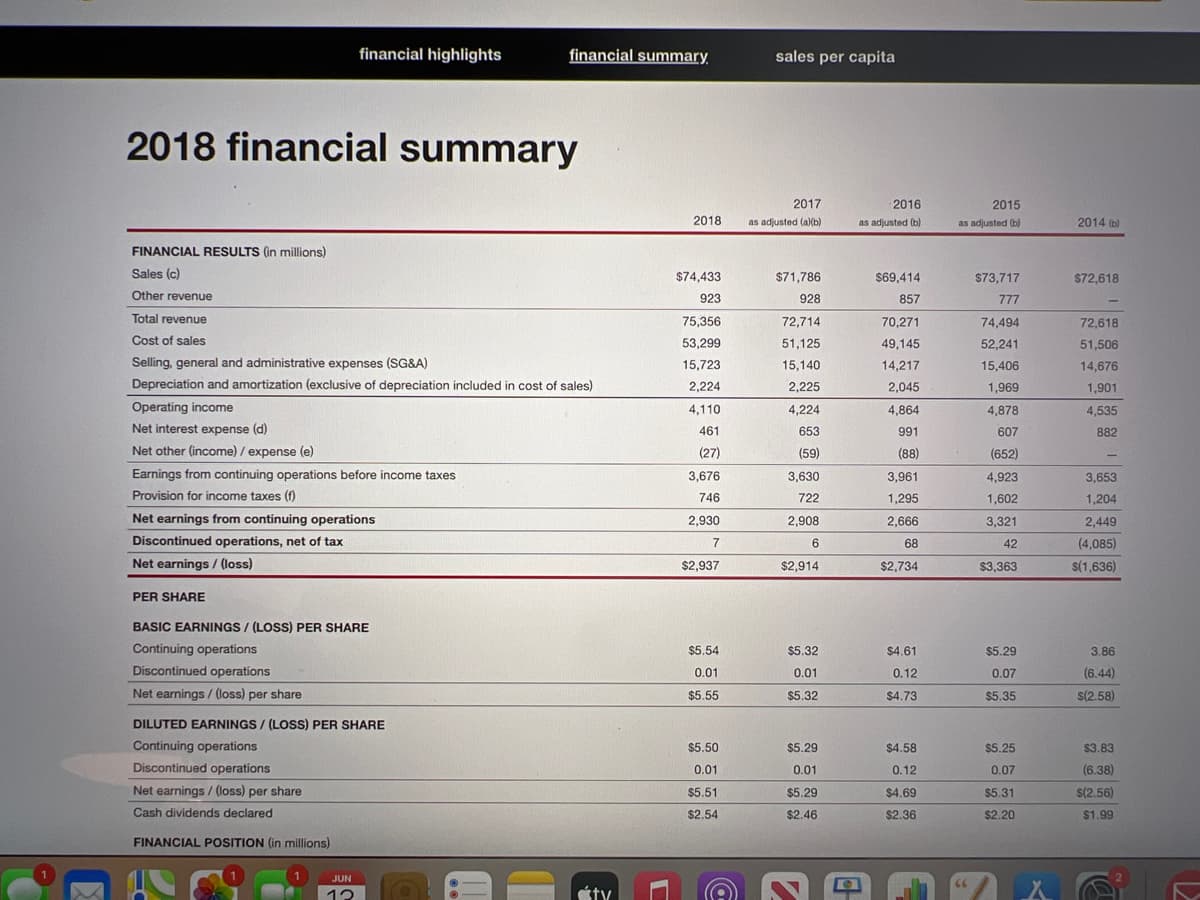
2018 financial summary
FINANCIAL RESULTS (in millions)
Sales (c)
Other revenue
Total revenue
Cost of sales
Selling, general and administrative expenses (SG&A)
Depreciation and amortization (exclusive of depreciation included in cost of sales)
Operating income
Net interest expense (d)
Net other (income) / expense (e)
Earnings from continuing operations before income taxes
Provision for income taxes (f)
Net earnings from continuing operations
Discontinued operations, net of tax
Net earnings / (loss)
PER SHARE
BASIC EARNINGS/ (LOSS) PER SHARE
Continuing operations
Discontinued operations
Net earnings / (loss) per share
DILUTED EARNINGS/ (LOSS) PER SHARE
Continuing operations
Discontinued operations
Net earnings / (loss) per share
Cash dividends declared
FINANCIAL POSITION (in millions)
JUN
12
financial summary
ty
3
2018
$74,433
923
75,356
53,299
15,723
2,224
4,110
461
(27)
3,676
746
2,930
7
$2,937
$5.54
0.01
$5.55
$5.50
0.01
$5.51
$2.54
G
sales per capita
2017
as adjusted (a)(b)
$71,786
928
72,714
51,125
15,140
2,225
4,224
653
(59)
3,630
722
2,908
6
$2,914
$5.32
0.01
$5.32
$5.29
0.01
$5.29
$2.46
NA
2016
as adjusted (b)
$69,414
857
70,271
49,145
14,217
2,045
4,864
991
(88)
3,961
1,295
2,666
68
$2,734
$4.61
0.12
$4.73
$4.58
0.12
$4.69
$2.36
2015
as adjusted (b)
$73,717
777
74,494
52,241
15,406
1,969
4,878
607
(652)
4,923
1,602
3,321
42
$3,363
$5.29
0.07
$5.35
$5.25
0.07
$5.31
$2.20
66
A
2014 (b)
$72.618
-
72,618
51,506
14,676
1,901
4,535
882
3,653
1,204
2,449
(4,085)
$(1,636)
3.86
(6.44)
$(2.58)
$3.83
(6.38)
$(2.56)
$1.99
Transcribed Image Text:financial highlights 2018 financial summary FINANCIAL RESULTS (in millions) Sales (c) Other revenue Total revenue Cost of sales Selling, general and administrative expenses (SG&A) Depreciation and amortization (exclusive of depreciation included in cost of sales) Operating income Net interest expense (d) Net other (income) / expense (e) Earnings from continuing operations before income taxes Provision for income taxes (f) Net earnings from continuing operations Discontinued operations, net of tax Net earnings / (loss) PER SHARE BASIC EARNINGS/ (LOSS) PER SHARE Continuing operations Discontinued operations Net earnings / (loss) per share DILUTED EARNINGS/ (LOSS) PER SHARE Continuing operations Discontinued operations Net earnings / (loss) per share Cash dividends declared FINANCIAL POSITION (in millions) JUN 12 financial summary ty 3 2018 $74,433 923 75,356 53,299 15,723 2,224 4,110 461 (27) 3,676 746 2,930 7 $2,937 $5.54 0.01 $5.55 $5.50 0.01 $5.51 $2.54 G sales per capita 2017 as adjusted (a)(b) $71,786 928 72,714 51,125 15,140 2,225 4,224 653 (59) 3,630 722 2,908 6 $2,914 $5.32 0.01 $5.32 $5.29 0.01 $5.29 $2.46 NA 2016 as adjusted (b) $69,414 857 70,271 49,145 14,217 2,045 4,864 991 (88) 3,961 1,295 2,666 68 $2,734 $4.61 0.12 $4.73 $4.58 0.12 $4.69 $2.36 2015 as adjusted (b) $73,717 777 74,494 52,241 15,406 1,969 4,878 607 (652) 4,923 1,602 3,321 42 $3,363 $5.29 0.07 $5.35 $5.25 0.07 $5.31 $2.20 66 A 2014 (b) $72.618 - 72,618 51,506 14,676 1,901 4,535 882 3,653 1,204 2,449 (4,085) $(1,636) 3.86 (6.44) $(2.58) $3.83 (6.38) $(2.56) $1.99
Expert Solution
trending now

Trending now

This is a popular solution!

steps

Step by step

Solved in 2 steps

Blurred answer
Knowledge Booster
Financial Statements
Learn more about
Need a deep-dive on the concept behind this application? Look no further. Learn more about this topic, accounting and related others by exploring similar questions and additional content below.
Similar questions
  • SEE MORE QUESTIONS
Recommended textbooks for you
Financial Accounting: The Impact on Decision Make…
Accounting
ISBN:
9781305654174
Author:
Gary A. Porter, Curtis L. Norton
Publisher:
Cengage Learning