I need help filling in the following blanks based on the attached table: The median frequency of attendance is [Blank]. This means [Blank] percent of people in this sample attend [Blank] or less. The 36th percentile is [Blank]. That means [Blank] percent of people in the same area attend [Blank] or less frequently. The 65th percentile is [Blank]. That means [Blank] percent of people in the same area attend [Blank] or less frequently. frequently.
I need help filling in the following blanks based on the attached table: The median frequency of attendance is [Blank]. This means [Blank] percent of people in this sample attend [Blank] or less. The 36th percentile is [Blank]. That means [Blank] percent of people in the same area attend [Blank] or less frequently. The 65th percentile is [Blank]. That means [Blank] percent of people in the same area attend [Blank] or less frequently. frequently.

MATLAB: An Introduction with Applications
6th Edition
ISBN:9781119256830
Author:Amos Gilat
Publisher:Amos Gilat
Chapter1: Starting With Matlab
Section: Chapter Questions
Problem 1P

Related questions
Question
I need help filling in the following blanks based on the attached table:
The median frequency of attendance is [Blank]. This means [Blank] percent of people in this sample attend [Blank] or less.
The 36th percentile is [Blank]. That means [Blank] percent of people in the same area attend [Blank] or less frequently.
The 65th percentile is [Blank]. That means [Blank] percent of people in the same area attend [Blank] or less frequently.
frequently.
Transcribed Image Text:Snip & Sketch
A New
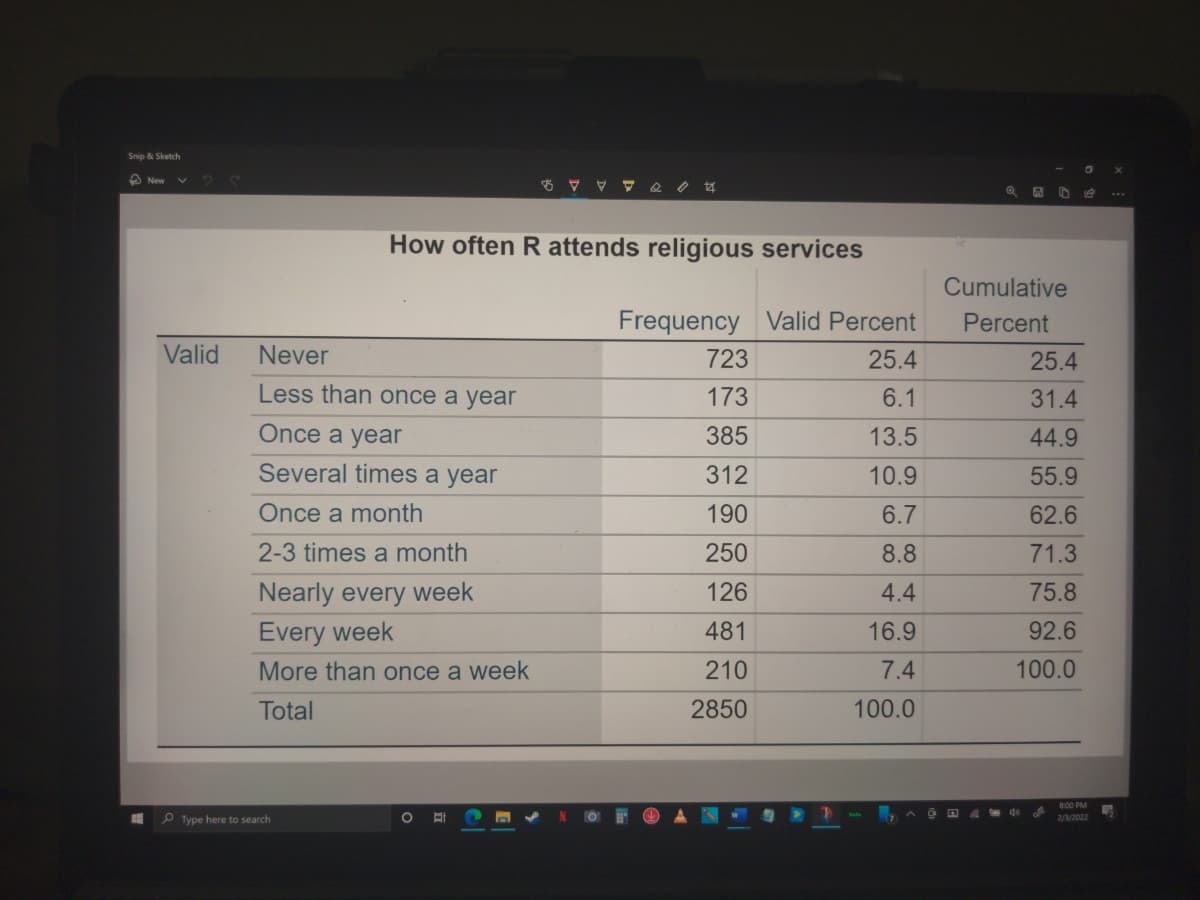
How often R attends religious services
Cumulative
Frequency
Valid Percent
Percent
Valid
Never
723
25.4
25.4
Less than once a year
173
6.1
31.4
Once a year
385
13.5
44.9
Several times a year
312
10.9
55.9
Once a month
190
6.7
62.6
2-3 times a month
250
8.8
71.3
Nearly every week
Every week
126
4.4
75.8
481
16.9
92.6
More than once a week
210
7.4
100.0
Total
2850
100.0
8:00 PM
O O A de
2/3/2022
P Type here to search
Expert Solution
Step 1
.
| Frequency | Valid Percent | Cumulative Percent | |
| Never | 723 | 25.4 | 25.4 |
| Less than once a year | 173 | 6.1 | 31.5 |
| Once a year | 385 | 13.5 | 45 |
| Several times a year | 312 | 10.9 | 55.9 |
| Once a month | 190 | 6.7 | 62.6 |
| 2-3 times a month | 250 | 8.8 | 71.4 |
| Nearly every week | 126 | 4.4 | 75.8 |
| Every week | 481 | 16.9 | 92.6 |
| More than once a week | 210 | 7.4 | 100 |
| Total | 2850 | 100 |

Trending now
This is a popular solution!

Step by step
Solved in 2 steps

Recommended textbooks for you
MATLAB: An Introduction with Applications
Statistics
ISBN:
9781119256830
Author:
Amos Gilat
Publisher:
John Wiley & Sons Inc

Probability and Statistics for Engineering and th…
Statistics
ISBN:
9781305251809
Author:
Jay L. Devore
Publisher:
Cengage Learning

Statistics for The Behavioral Sciences (MindTap C…
Statistics
ISBN:
9781305504912
Author:
Frederick J Gravetter, Larry B. Wallnau
Publisher:
Cengage Learning
MATLAB: An Introduction with Applications
Statistics
ISBN:
9781119256830
Author:
Amos Gilat
Publisher:
John Wiley & Sons Inc
Probability and Statistics for Engineering and th…
Statistics
ISBN:
9781305251809
Author:
Jay L. Devore
Publisher:
Cengage Learning
Statistics for The Behavioral Sciences (MindTap C…
Statistics
ISBN:
9781305504912
Author:
Frederick J Gravetter, Larry B. Wallnau
Publisher:
Cengage Learning

Elementary Statistics: Picturing the World (7th E…
Statistics
ISBN:
9780134683416
Author:
Ron Larson, Betsy Farber
Publisher:
PEARSON

The Basic Practice of Statistics
Statistics
ISBN:
9781319042578
Author:
David S. Moore, William I. Notz, Michael A. Fligner
Publisher:
W. H. Freeman

Introduction to the Practice of Statistics
Statistics
ISBN:
9781319013387
Author:
David S. Moore, George P. McCabe, Bruce A. Craig
Publisher:
W. H. Freeman