I need to see a line graph for the following data and which (if any) of the individuals (A or B) has diabetes? Also, if the time period was extended to six hours, what would the expected glucose level for Person B be?
I need to see a line graph for the following data and which (if any) of the individuals (A or B) has diabetes? Also, if the time period was extended to six hours, what would the expected glucose level for Person B be?

Nutrition Through The Life Cycle
7th Edition
ISBN:9781337919333
Author:Brown, Judith E.
Publisher:Brown, Judith E.
Chapter3: Preconception Nutrition- Conditions And Interventions
Section: Chapter Questions
Problem 13RQ

Related questions
Question
100%
I need to see a line graph for the following data and which (if any) of the individuals (A or B) has diabetes? Also, if the time period was extended to six hours, what would the expected glucose level for Person B be?
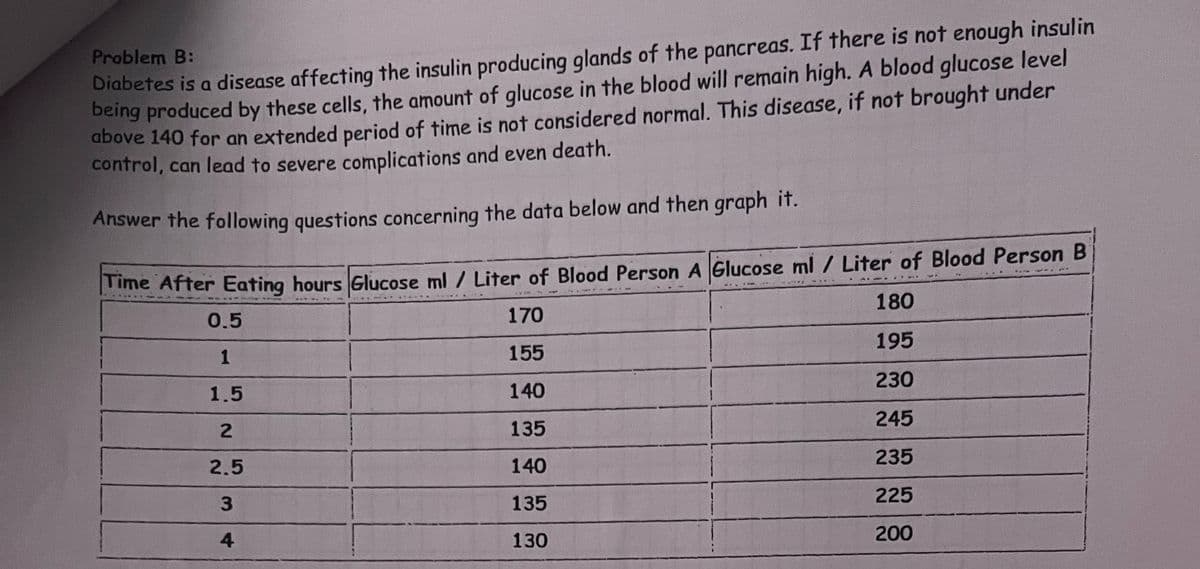
Transcribed Image Text:Problem B:
Diabetes is a disease affecting the insulin producing glands of the pancreas. If there is not enough insulin
being produced by these cells, the amount of glucose in the blood will remain high. A blood glucose level
above 140 for an extended period of time is not considered normal. This disease, if not brought under
control, can lead to severe complications and even death.
Answer the following questions concerning the data below and then graph it.
Time After Eating hours Glucose ml / Liter of Blood Person A Glucose ml / Liter of Blood Person B
180
170
155
195
140
230
135
245
140
235
135
225
130
200
0.5
1
1.5
2
2.5
3
4
Expert Solution
This question has been solved!
Explore an expertly crafted, step-by-step solution for a thorough understanding of key concepts.

This is a popular solution!

Trending now
This is a popular solution!

Step by step
Solved in 3 steps with 1 images

Knowledge Booster


Learn more about
Need a deep-dive on the concept behind this application? Look no further. Learn more about this topic, biology and related others by exploring similar questions and additional content below.Recommended textbooks for you
Nutrition Through The Life Cycle
Health & Nutrition
ISBN:
9781337919333
Author:
Brown, Judith E.
Publisher:
Cengage Learning,

Nutrition Through The Life Cycle
Health & Nutrition
ISBN:
9781337919333
Author:
Brown, Judith E.
Publisher:
Cengage Learning,
Nutritional Sciences: From Fundamentals to Food, …
Health & Nutrition
ISBN:
9781337486415
Author:
McGuire
Publisher:
Cengage