ib CaTculate the coefficient of correlation by the method of concurrent deviation. 1981 Year Supply (X) Price (Y) 1982 1983 1984 1985 1986 1987 1988 1989 180 182 186 191 183 185 189 196 193 46 40 30 17 33 27 15 12 13
ib CaTculate the coefficient of correlation by the method of concurrent deviation. 1981 Year Supply (X) Price (Y) 1982 1983 1984 1985 1986 1987 1988 1989 180 182 186 191 183 185 189 196 193 46 40 30 17 33 27 15 12 13

Glencoe Algebra 1, Student Edition, 9780079039897, 0079039898, 2018
18th Edition
ISBN:9780079039897
Author:Carter
Publisher:Carter
Chapter4: Equations Of Linear Functions
Section4.5: Correlation And Causation
Problem 23PFA

Related questions
Question
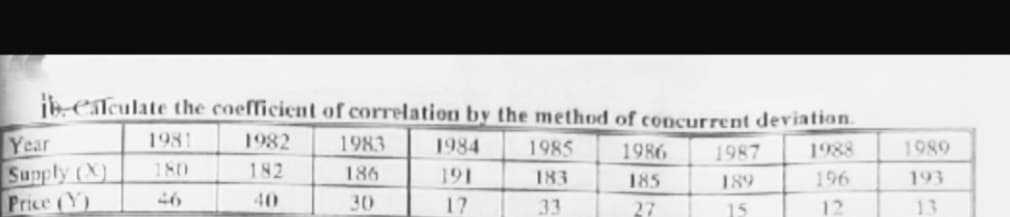
Transcribed Image Text:ib CTculate the coefficient of correlation by the method of concurrent deviation.
1981
1982
Year
Supply (X)
Price (Y)
1983
1984
1985
1986
1987
1988
1989
180
182
186
191
183
185
189
196
193
46
40
30
17
33
27
15
12
13
Expert Solution
This question has been solved!
Explore an expertly crafted, step-by-step solution for a thorough understanding of key concepts.

Step by step
Solved in 2 steps with 2 images

Recommended textbooks for you
Glencoe Algebra 1, Student Edition, 9780079039897…
Algebra
ISBN:
9780079039897
Author:
Carter
Publisher:
McGraw Hill
Glencoe Algebra 1, Student Edition, 9780079039897…
Algebra
ISBN:
9780079039897
Author:
Carter
Publisher:
McGraw Hill