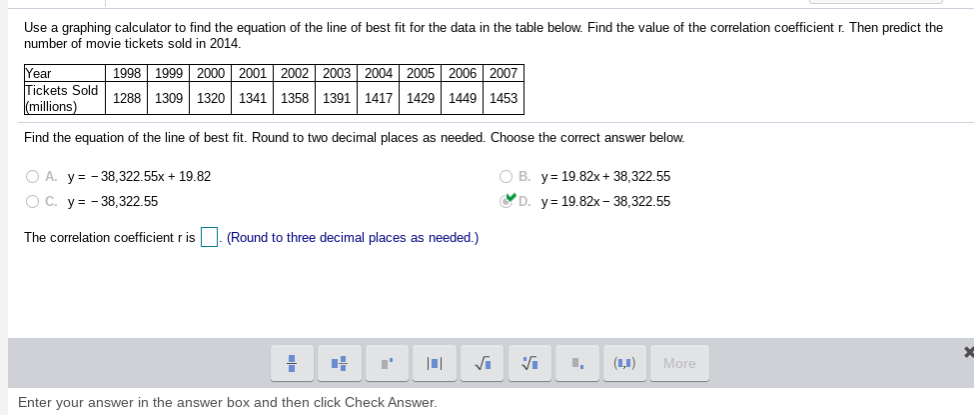
Use a graphing calculator to find the equation of the line of best fit for the data in the table below. Find the value of the correlation coefficient r. Then predict the number of movie tickets sold in 2014. Year Tickets Sold (millions) 1998 1999 2000 | 2001 | 2002 | 2003 2004 2005 | 2006 | 2007 1288 1309 1320 1341| 1358 1391 1417 | 1429 1449 | 1453


Correlation
Correlation defines a relationship between two independent variables. It tells the degree to which variables move in relation to each other. When two sets of data are related to each other, there is a correlation between them.
Linear Correlation
A correlation is used to determine the relationships between numerical and categorical variables. In other words, it is an indicator of how things are connected to one another. The correlation analysis is the study of how variables are related.
Regression Analysis
Regression analysis is a statistical method in which it estimates the relationship between a dependent variable and one or more independent variable. In simple terms dependent variable is called as outcome variable and independent variable is called as predictors. Regression analysis is one of the methods to find the trends in data. The independent variable used in Regression analysis is named Predictor variable. It offers data of an associated dependent variable regarding a particular outcome.


Trending now
This is a popular solution!

Step by step
Solved in 2 steps with 1 images


