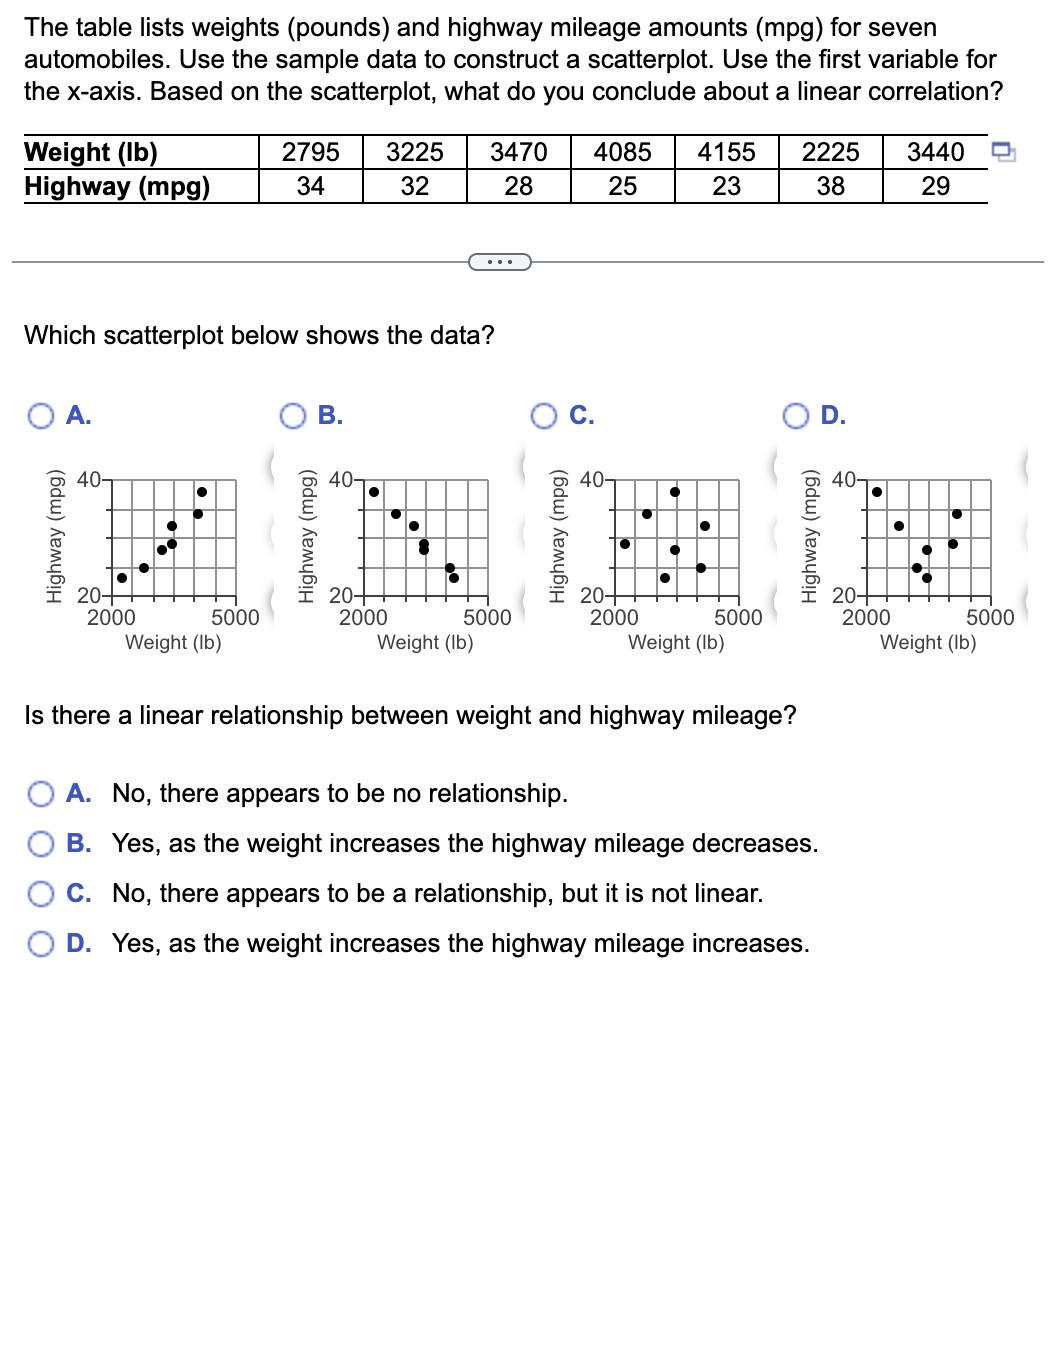
The table lists weights (pounds) and highway mileage amounts (mpg) for seven automobiles. Use the sample data to construct a scatterplot. Use the first variable for the x-axis. Based on the scatterplot, what do you conclude about a linear correlation? Weight (lb) Highway (mpg) Which scatterplot below shows the data? A. 40- 20- 2000 5000 2795 3225 3470 32 34 28 Weight (lb) B. 40- 20+ 2000 D 5000 Weight (lb) 4085 4155 2225 25 23 38 C. ● 20+ 2000 ● ● ● ● 5000 Weight (lb) Is there a linear relationship between weight and highway mileage? A. No, there appears to be no relationship. B. Yes, as the weight increases the highway mileage decreases. C. No, there appears to be a relationship, but it is not linear. D. Yes, as the weight increases the highway mileage increases. 40- 20- 2000 3440 29 5000 Weight (lb)
The table lists weights (pounds) and highway mileage amounts (mpg) for seven automobiles. Use the sample data to construct a scatterplot. Use the first variable for the x-axis. Based on the scatterplot, what do you conclude about a linear correlation? Weight (lb) Highway (mpg) Which scatterplot below shows the data? A. 40- 20- 2000 5000 2795 3225 3470 32 34 28 Weight (lb) B. 40- 20+ 2000 D 5000 Weight (lb) 4085 4155 2225 25 23 38 C. ● 20+ 2000 ● ● ● ● 5000 Weight (lb) Is there a linear relationship between weight and highway mileage? A. No, there appears to be no relationship. B. Yes, as the weight increases the highway mileage decreases. C. No, there appears to be a relationship, but it is not linear. D. Yes, as the weight increases the highway mileage increases. 40- 20- 2000 3440 29 5000 Weight (lb)

Big Ideas Math A Bridge To Success Algebra 1: Student Edition 2015
1st Edition
ISBN:9781680331141
Author:HOUGHTON MIFFLIN HARCOURT
Publisher:HOUGHTON MIFFLIN HARCOURT
Chapter4: Writing Linear Equations
Section: Chapter Questions
Problem 11CT

Related questions
Question
Transcribed Image Text:The table lists weights (pounds) and highway mileage amounts (mpg) for seven
automobiles. Use the sample data to construct a scatterplot. Use the first variable for
the x-axis. Based on the scatterplot, what do you conclude about a linear correlation?
Weight (lb)
Highway (mpg)
Which scatterplot below shows the data?
A.
40-
20-
2000
5000
2795 3225 3470
32
34
28
Weight (lb)
B.
40-
20+
2000
D
5000
Weight (lb)
4085 4155 2225
25
23
38
C.
●
20+
2000
●
●
●
●
5000
Weight (lb)
Is there a linear relationship between weight and highway mileage?
A. No, there appears to be no relationship.
B. Yes, as the weight increases the highway mileage decreases.
C. No, there appears to be a relationship, but it is not linear.
D. Yes, as the weight increases the highway mileage increases.
40-
20-
2000
3440
29
5000
Weight (lb)
Expert Solution
This question has been solved!
Explore an expertly crafted, step-by-step solution for a thorough understanding of key concepts.

This is a popular solution!

Trending now
This is a popular solution!

Step by step
Solved in 3 steps with 1 images

Recommended textbooks for you
Big Ideas Math A Bridge To Success Algebra 1: Stu…
Algebra
ISBN:
9781680331141
Author:
HOUGHTON MIFFLIN HARCOURT
Publisher:
Houghton Mifflin Harcourt

Glencoe Algebra 1, Student Edition, 9780079039897…
Algebra
ISBN:
9780079039897
Author:
Carter
Publisher:
McGraw Hill

Holt Mcdougal Larson Pre-algebra: Student Edition…
Algebra
ISBN:
9780547587776
Author:
HOLT MCDOUGAL
Publisher:
HOLT MCDOUGAL
Big Ideas Math A Bridge To Success Algebra 1: Stu…
Algebra
ISBN:
9781680331141
Author:
HOUGHTON MIFFLIN HARCOURT
Publisher:
Houghton Mifflin Harcourt
Glencoe Algebra 1, Student Edition, 9780079039897…
Algebra
ISBN:
9780079039897
Author:
Carter
Publisher:
McGraw Hill
Holt Mcdougal Larson Pre-algebra: Student Edition…
Algebra
ISBN:
9780547587776
Author:
HOLT MCDOUGAL
Publisher:
HOLT MCDOUGAL