
Biology: The Dynamic Science (MindTap Course List)
4th Edition
ISBN:9781305389892
Author:Peter J. Russell, Paul E. Hertz, Beverly McMillan
Publisher:Peter J. Russell, Paul E. Hertz, Beverly McMillan
Chapter35: Plant Nutrition
Section: Chapter Questions
Problem 16TYK

Related questions
Question
Transcribed Image Text:Q Review /
ABC
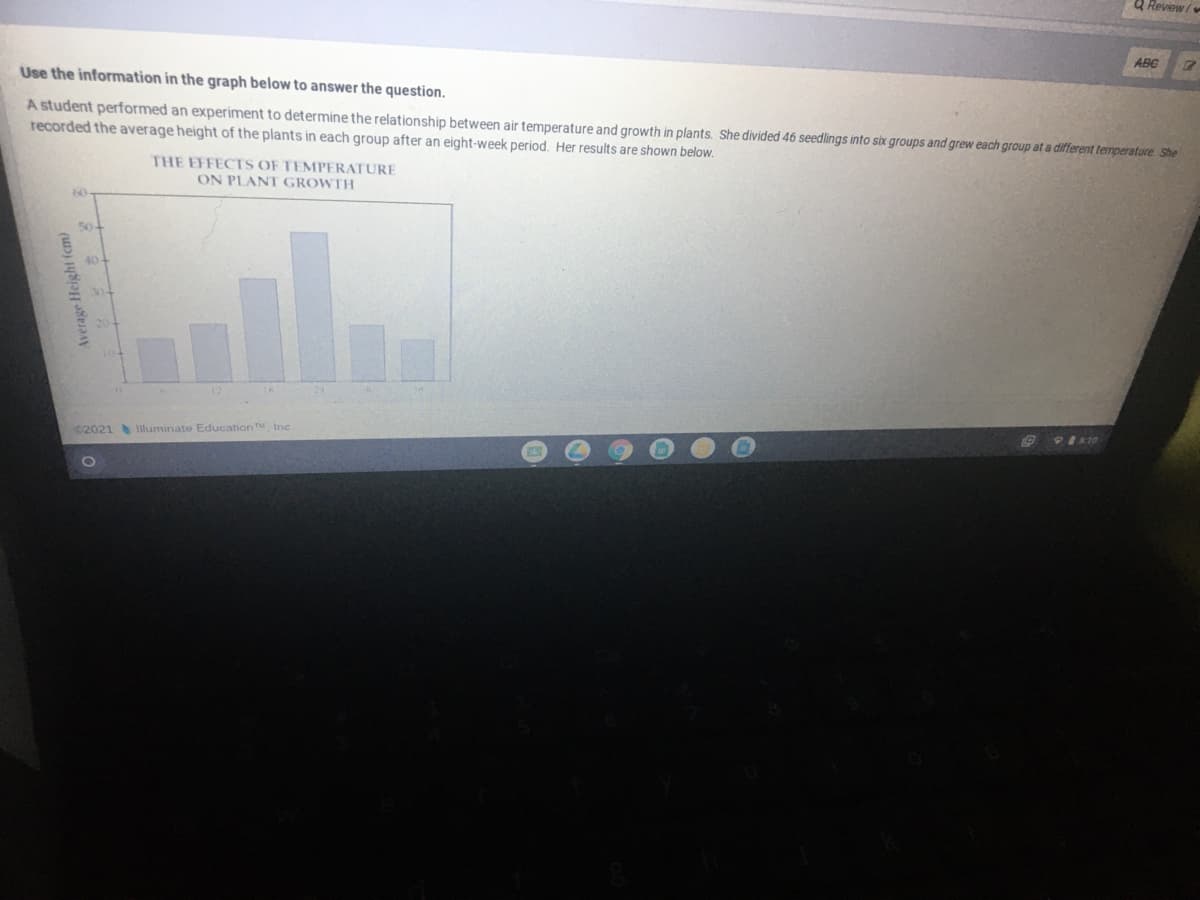
Use the information in the graph below to answer the question.
A student performed an experiment to determine the relationship between air temperature and growth in plants. She divided 46 seedlings into six groups and grew each group at a different temperature She
recorded the average height of the plants in each group after an eight-week period. Her results are shown below.
THE EFFECTS OF TEMPERATURE
ON PLANT GROWTH
50-
12
2021 luminate EducationM, Inc
Average Height (m)
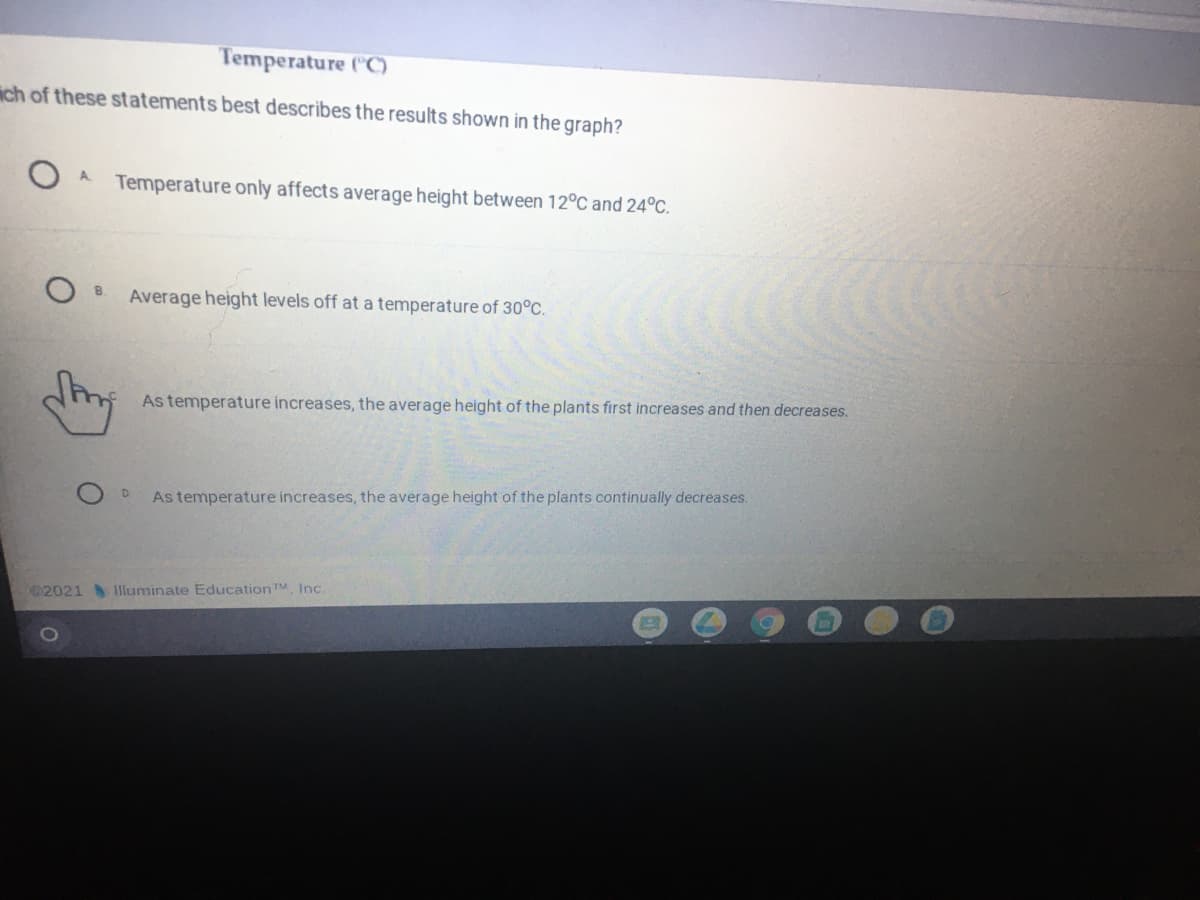
Transcribed Image Text:Temperature ("C)
ich of these statements best describes the results shown in the graph?
A
Temperature only affects average height between 12°C and 24°C.
B.
Average height levels off at a temperature of 30°C.
As temperature increases, the average height of the plants first increases and then decreases.
As temperature increases, the average height of the plants continually decreases.
D.
2021 Hluminate EducationTM Inc.
Expert Solution
This question has been solved!
Explore an expertly crafted, step-by-step solution for a thorough understanding of key concepts.

This is a popular solution!

Trending now
This is a popular solution!

Step by step
Solved in 3 steps

Knowledge Booster


Learn more about
Need a deep-dive on the concept behind this application? Look no further. Learn more about this topic, biology and related others by exploring similar questions and additional content below.Recommended textbooks for you
Biology: The Dynamic Science (MindTap Course List)
Biology
ISBN:
9781305389892
Author:
Peter J. Russell, Paul E. Hertz, Beverly McMillan
Publisher:
Cengage Learning

Biology: The Dynamic Science (MindTap Course List)
Biology
ISBN:
9781305389892
Author:
Peter J. Russell, Paul E. Hertz, Beverly McMillan
Publisher:
Cengage Learning