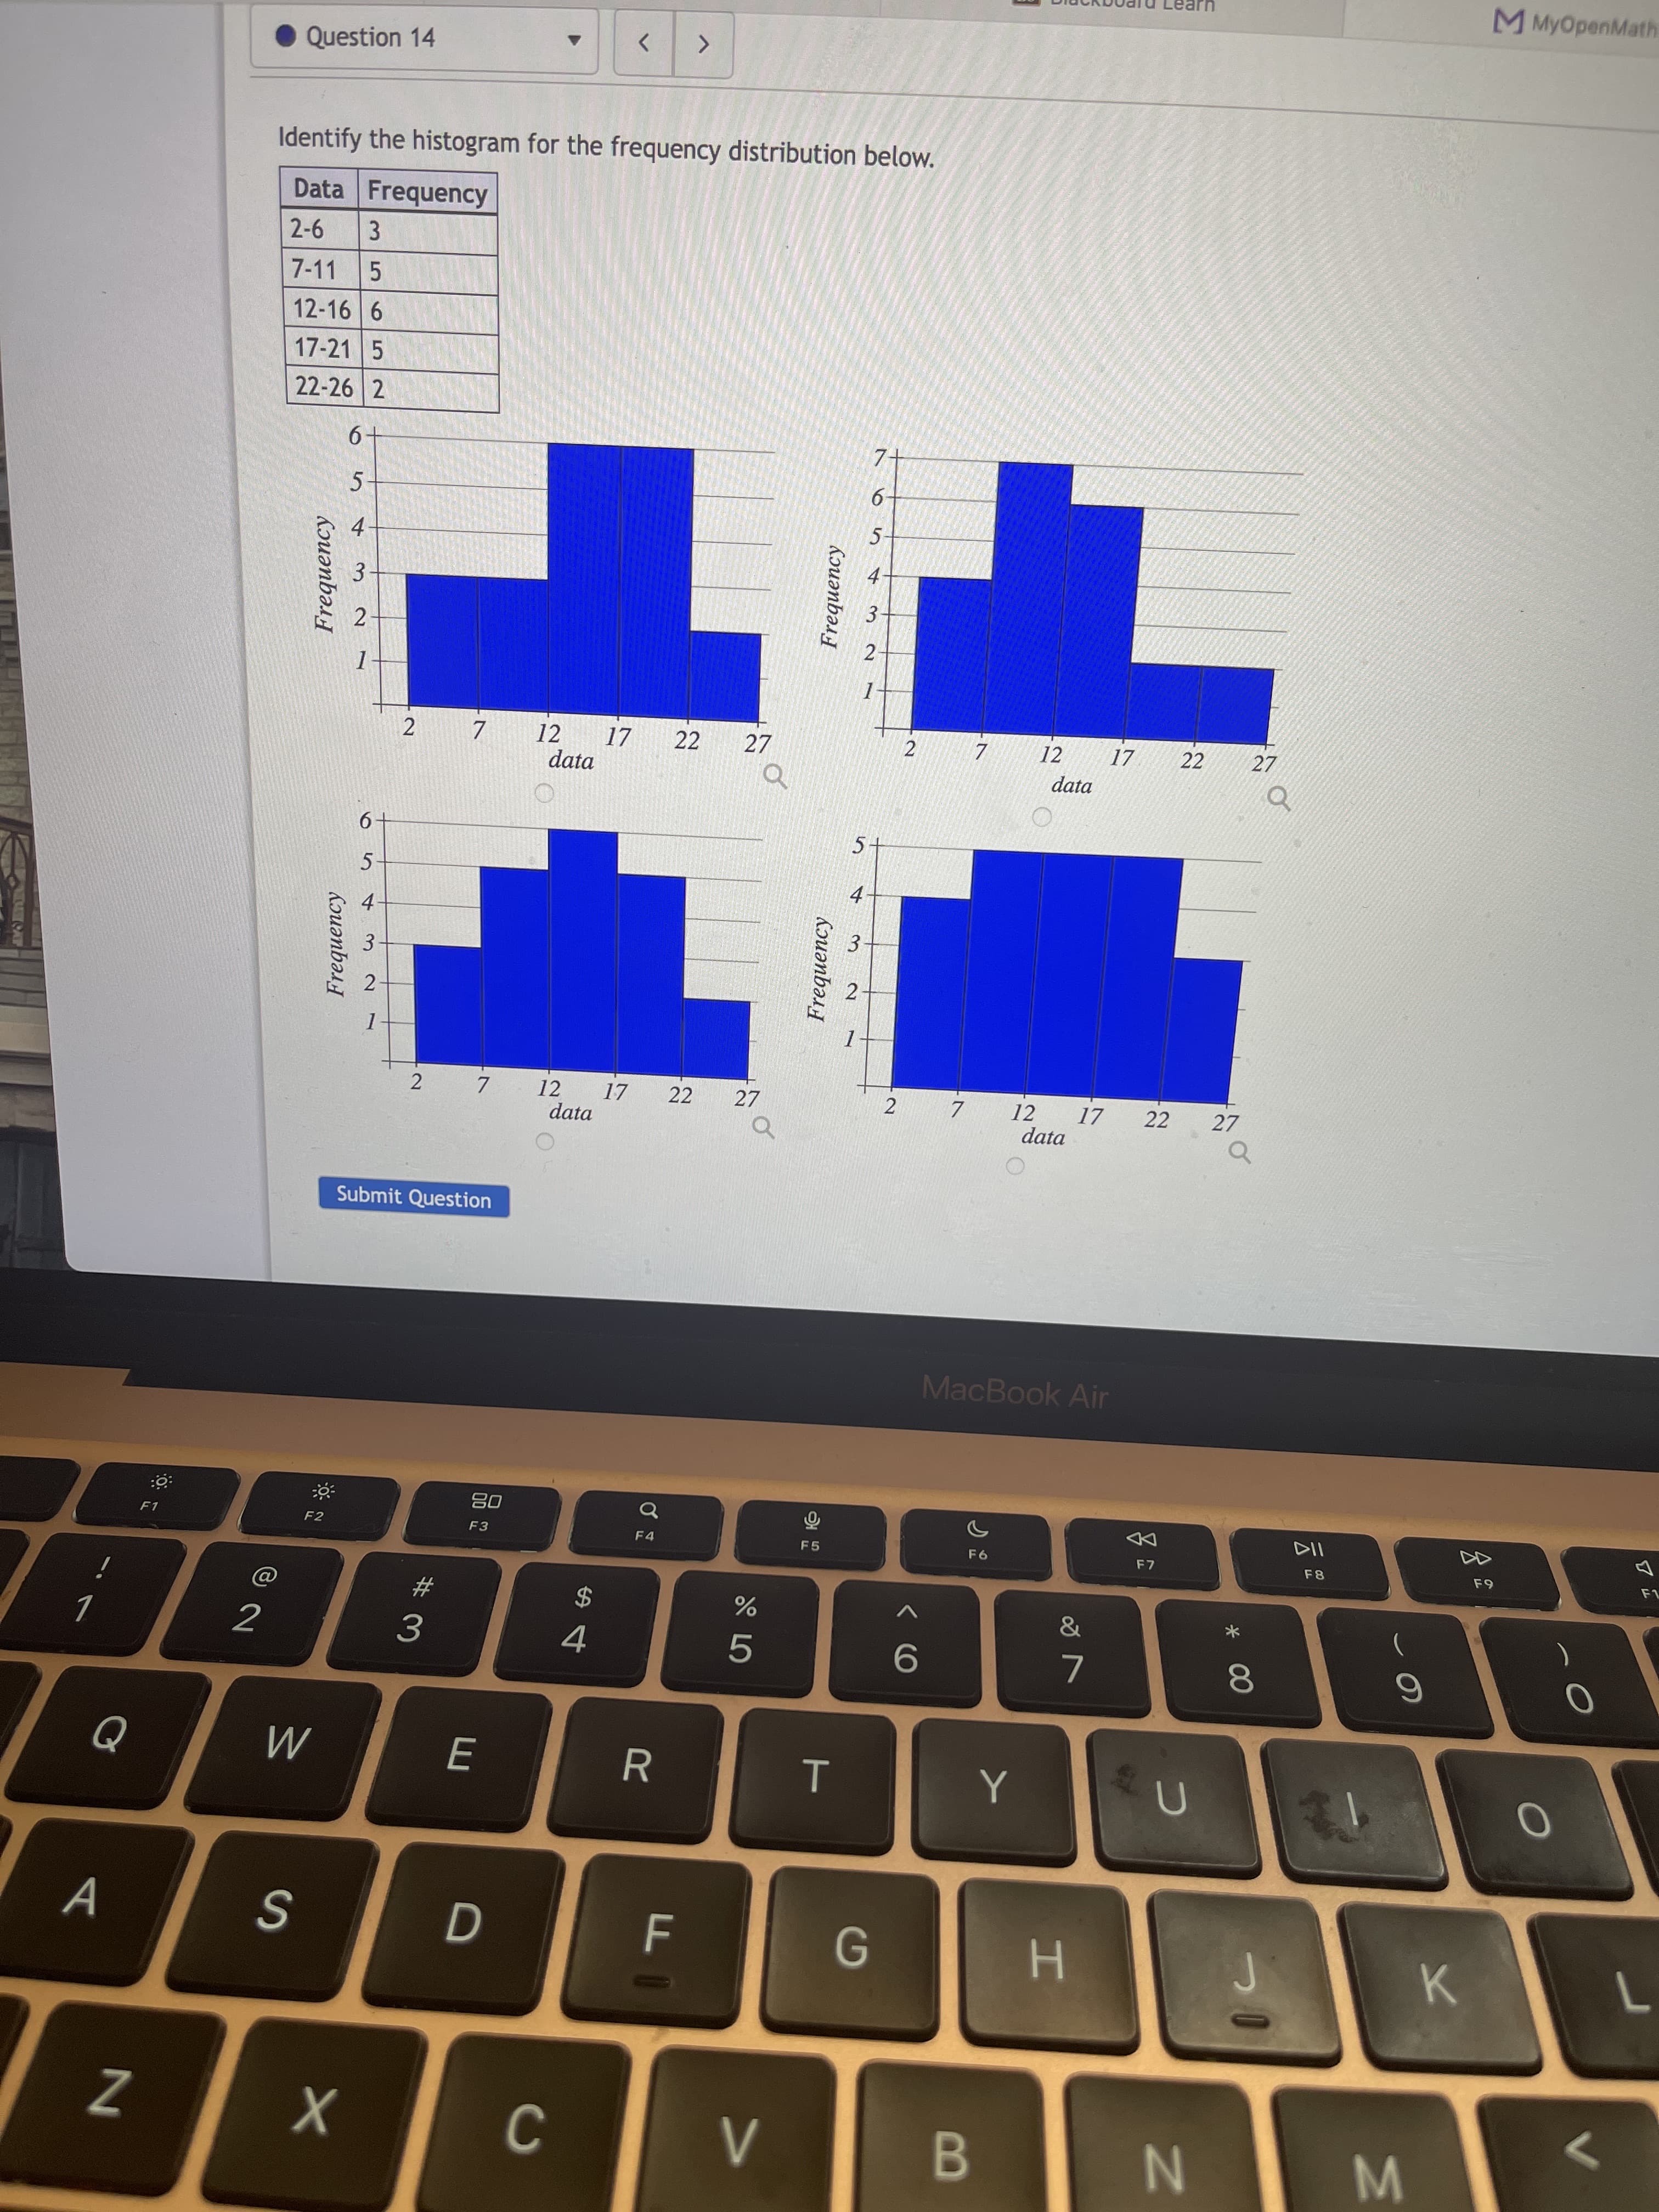
Identify the histogram for the frequency distribution below. Data Frequency 2-6 3 7-11 12-16 6 17-21 5 22-26 2 6+
Q: Exhibit 1 Stem-and-leaf of Data: Amount of Money earned in a day in dollars Leaf Unit = 10 N = * 2…
A: Since you have posted a question with multiple sub-parts, we will solve first three subparts for…
Q: This data represent the age distribution of a sample of 100 people covered by health insurar…
A: data: Age ( classes) number (f) 25-34 23 35-44 29 45-54 28 55-64 20
Q: Approximate the percentile rank of the data value 12. 12, 8, 11, 19, 14, 13, 4, 20 O 69th percentile…
A:
Q: Exhibit 1 Stem-and-leaf of Data: Amount of Money earned in a day in dollars Leaf Unit = 10 N = 2 59…
A: If the skewness is between -0.5 and 0.5, the data are fairly symmetrical. If the skewness is between…
Q: Find the (a) mean, (b) median, (c) mode, and (d) midrange for the data and then (e) answer the given…
A: Since you have posted a question with multiple sub-parts, we will solve first three subparts for…
Q: O c. They are an attempt to represent the underlying population distribution
A: Statistical populations tend to trace the empirical distribution: statistical distribution -…
Q: Exhibit 1 Stem-and-leaf of Data: Amount of Money earned in a day in dollars Leaf Unit 10 N = 59 3…
A: Note: Since you have posted a question with multiple sub-parts, we will solve first three sub-parts…
Q: Consider the data set 7 8 2 3 3 5 2 Find the average (mean): Find the median: Question Help: Video 1…
A:
Q: Classify the following data. Indicate whether the data is qualitative or quantitative, indicate…
A: Qualitative data: The data value are the the non-numerical quality or characteristic. Quantitative…
Q: Find the percentile for the data value. Data set: 2 2 7 4 2 5 9 9 11 3 2 9 6 1 9; data value: 7
A: Sort the data values in ascending order
Q: The scores on a recent statistics exam are shown below. Construct a stem and leaf plot for the data.…
A:
Q: Which of the following statistics would be helpful for measuring dispersion? (the spread
A: Given problem Given that Which of the following statistics would be helpful for measuring…
Q: Blood alcohol concentrations of drivers involved in fatal crashes and then given jail sentences are…
A: Here is the solution
Q: Consider the data set below. Construct a stem-and-leaf plot for this data. 7, 8, 13, 19, 23, 25, 25,…
A:
Q: The data below list the number of laptop computers owned by families in each of 40 homes in a…
A: Here, n=40 Mean = xi/n Mean=…
Q: C. You were given the following grouped data for the number of days it took 57 sales employees to…
A:
Q: 2. For the following set of data, find the mean, median, and mode. Put the data in a frequency…
A: Mean = (summation Xi)/n = (5+8+7+3+2+2+5+6+1+4)/10 =4.3
Q: Whats the step by step process in excel for getting the frequency distribution and percentage…
A: Excel procedure for frequency distribution: Type your data into a worksheet Sort the data in…
Q: Consider the chart below that describes the average student runner speeds. Find the percentile…
A: Given data of average student runner speeds as shown below2 2.5 3 4 5 6 2.75 8 107 4 5.5 8 2 3.5 5.5…
Q: For the frequency distribution shown, compute : mean , median , mode , mean deviation , sample…
A:
Q: Find the three measures of central tendency (the mean, median, and mode). (If an answer does not…
A:
Q: Use a table of z-scores and percentiles to find the percentage of data items in a normal…
A:
Q: Use the data to make a frequency table. 1. number of students per class: 26 18 25 28 24 27 30 15 25…
A:
Q: The data represent the time, in minutes, spent reading a political blog in a day. Construct a…
A: Given the data which represents the time in minutes spent reading a political blog. Given that…
Q: For the data below construct the frequency distribution table with 5 classes and after that find: 1)…
A: Given data is appropriate for measures of central tendency to find the central value for the given…
Q: Blood alcohol concentrations of drivers involved in fatal crashes and then given jail sentences are…
A:
Q: Identify the elements in the figure that show (a) the mean and (b) indicate a measure of variability…
A: The given figure shows the mean and variability of four Body tissues- Fin, Muscle, Blood and Plasma…
Q: Cholesterol levels were collected from patients two days after they had a heart attack and are the…
A: Given data: To find: 1.Mean 2. Median 3.Mode
Q: Which is a statistical graph that displays only the range of values on the horizontal axis? O…
A:
Q: identify the Cummulative Frequency Distribution Scores Number of Students 50-59…
A: Cumulative frequency: Cumulative frequencies are obtained by adding each frequency from a frequency…
Q: Home Runs Hit 2002 2003 2004 Name Steve Connor 0007 2001 6T 41 666T 35 32 24 18 31 14 22 24 Which…
A: Range is the difference between the lowest and highest values. Range of Steve : 35 - 18 = 17…
Q: sing the constructed grouped frequency distribution below, find the following: A. mean B. median C.…
A: Hello. Since your question has multiple parts, we will solve first 3sub parts question for you. If…
Q: e following data (3, 6, 9, 12, 14, 16) , the mean equal
A: The data is given as below 3,6,9,12,14,16
Q: Determine the distribution of the data pictured below 2.5 1.5 0.5 1 3 5 7 data O Uniform Bell-shaped…
A: Determine the distribution of thr data of picture
Q: Use the dataset below to calculate the median. Report your answer with one decimal place. 2 18 13 20…
A:
Q: Fird the (a) mean, (b) median, (c) mode, and (d) midrange for the data and then (e) answer the given…
A: Formula : Midrange= (maximum + minimum) /2
Q: Complete the table and find the mean, median and mode. NOTE: Draw the table in your paper. CLASSES…
A: Classes Frequency Class boundaries Class mark(x) Cumulative frequency fx 21-30 5 20.5-30.5 25.5 5…
Q: The data below is shown in a stem and leaf plot. Calculate the mean and median. 1 | 001126 2|…
A:
Q: The data represent the time, in minutes, spent reading a political blog in a day. Construct a…
A:
Q: Data Points frequency 1.2 4.8 8 8.4 30 12.0 15.6 3
A:
Q: The durations (minutes) of 26 electric power outages in the community of Sonando Heights over the…
A: a) The mean is calculated as follows, mean=X=∑i=1nXinX=86626X=33.3077 The median is calculated as…
Q: Construct a frequency distribution and a frequency histogram of the data using the indicated number…
A: The given data is Patients= 6 9 7 14 4 5 6 8 4 11 10 6 8 6 5 7 6 6 3 11
Q: Lets' Try! Which data set has a wider spread? a. 2, 3, 3, 4, 5, 6, 8 25th Percentile (Q,) = 3…
A:
Q: Exhibit 1 Stem-and-leaf of Data: Amount of Money earned in a day in dollars Leaf Unit = 10 N = * 2 2…
A: Stem-and-leaf data is given with leaf unit 10.
Q: • Complete the table and find the mean, median, mode of the grouped data. Class Limits Frequency…
A: Given the table class limits frequency class boundaries class mark cum freq less than 94-97 2…
Q: Construct a box plot for the given data below. Find the 5-number summary in the box plot. Fill in…
A: Answer:-
Q: The below distribution gives the pattern of overtime work per week done by 100 workers of a…
A: b)
Q: Determine whether the data described are nominal or ordinal. The hotel rooms available are ocean…
A: Given : The hotel rooms available are ocean view, mountain view, and poolside.
Trending now
This is a popular solution!
Step by step
Solved in 2 steps with 1 images