Use a table of z-scores and percentiles to find the percentage of data items in a normal distribution that lie between the following two z-scores. z= -2 and z= -0.5 Click the icon to view a table of z-scores and percentiles. O A. 30.85% O B. 28.57% O C. 2.28% D. 69.15%
Use a table of z-scores and percentiles to find the percentage of data items in a normal distribution that lie between the following two z-scores. z= -2 and z= -0.5 Click the icon to view a table of z-scores and percentiles. O A. 30.85% O B. 28.57% O C. 2.28% D. 69.15%

Glencoe Algebra 1, Student Edition, 9780079039897, 0079039898, 2018
18th Edition
ISBN:9780079039897
Author:Carter
Publisher:Carter
Chapter10: Statistics
Section10.4: Distributions Of Data
Problem 20PFA

Related questions

Question
100%
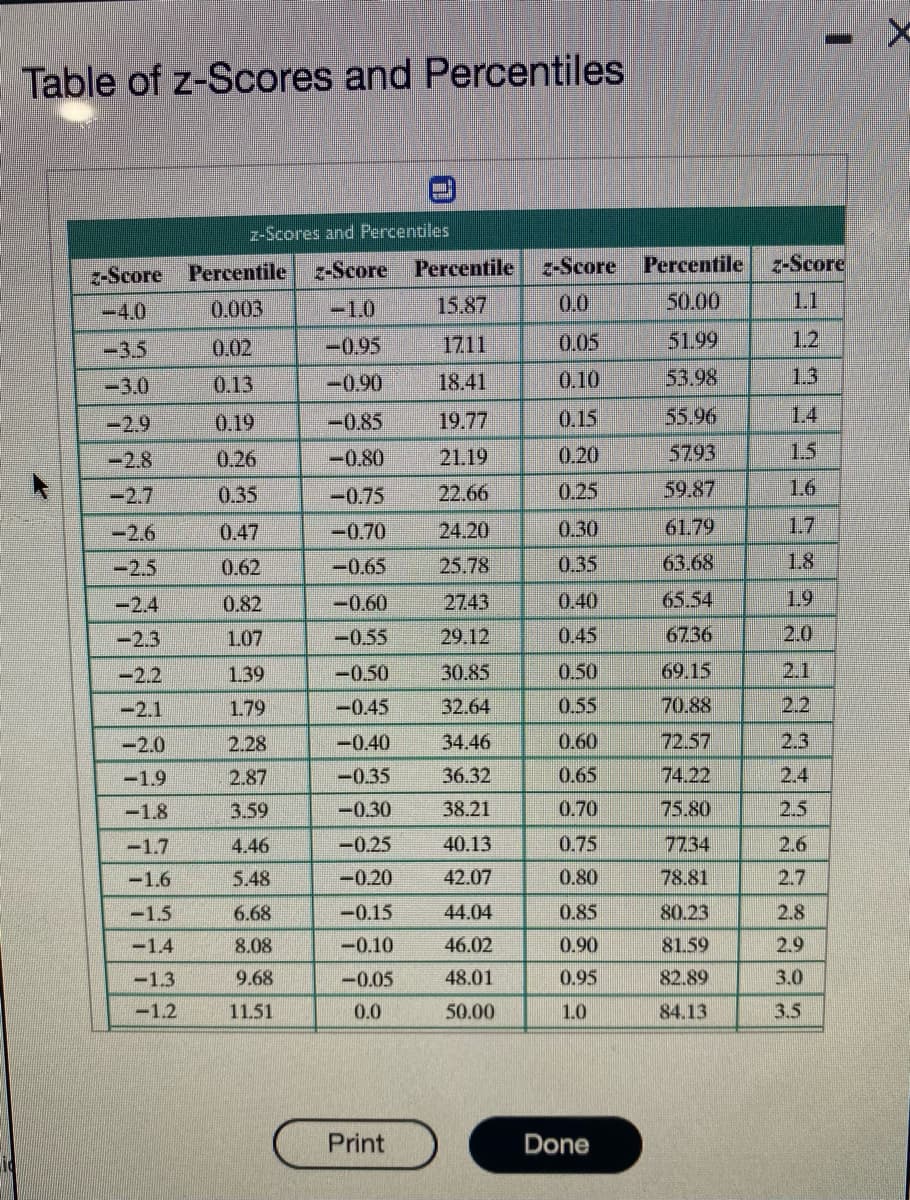
Transcribed Image Text:Table of z-Scores and Percentiles
z-Scores and Percentiles
z-Score
Percentile
z-Score
Percentile
z-Score Percentile
z-Score
-4.0
0.003
-1.0
15.87
0.0
50.00
1.1
-3.5
0.02
-095
1711
0.05
51.99
1.2
-3.0
0.13
-0.90
18.41
0.10
53.98
1.3
-2.9
0.19
-0.85
19.77
0.15
55.96
1.4
-2.8
0.26
-0.80
21.19
0.20
5793
1.5
-2.7
0.35
-0.75
22.66
0.25
59.87
1.6
-2.6
0.47
-0.70
24.20
0.30
61.79
1.7
-2.5
0.62
-0.65
25.78
0.35
63.68
1.8
-2.4
0.82
-0.60
2743
0.40
65.54
1.9
-2.3
1.07
-0.55
29.12
0.45
6736
2.0
-2.2
1.39
-0.50
30.85
0.50
69.15
2.1
-2.1
1.79
-0.45
32.64
0.55
70.88
2.2
-2.0
2.28
-0.40
34.46
0.60
72.57
2.3
-1.9
2.87
-0.35
36.32
0.65
74.22
2.4
-1.8
3.59
-0.30
38.21
0.70
75.80
2.5
-1.7
4.46
-0.25
40.13
0.75
7734
2.6
-1.6
5.48
-0.20
42.07
0.80
78.81
2.7
-1.5
6.68
-0.15
44.04
0.85
80.23
2.8
-1.4
8.08
-0.10
46.02
0.90
81.59
2.9
-1.3
9.68
-0.05
48.01
0.95
82.89
3.0
-1.2
11.51
0.0
50.00
1.0
84.13
3.5
Print
Done
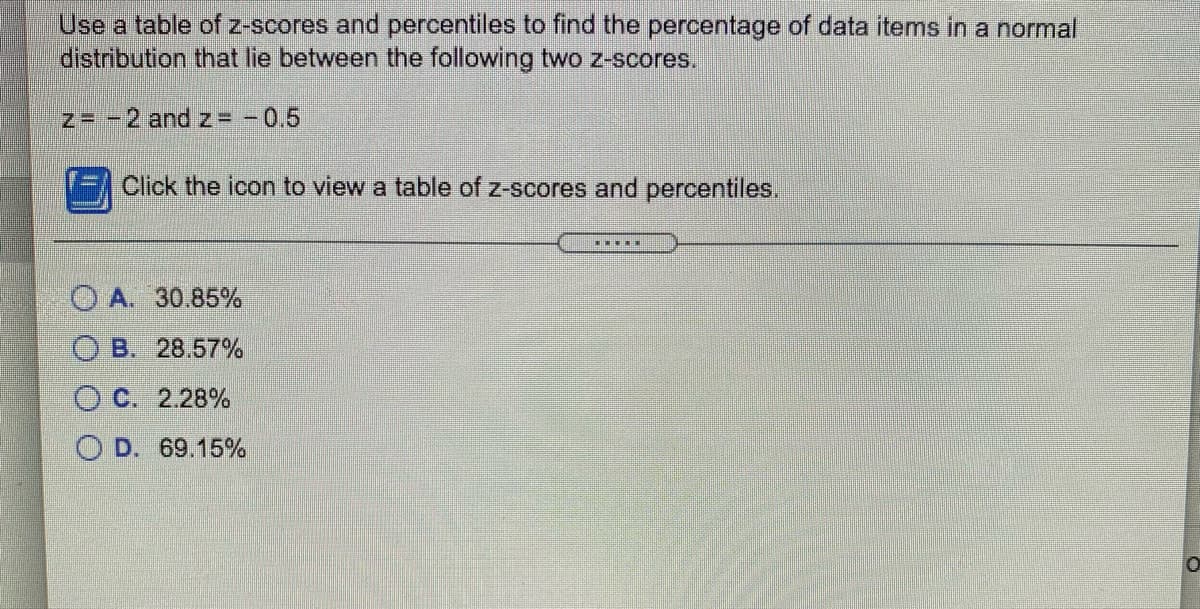
Transcribed Image Text:Use a table of z-scores and percentiles to find the percentage of data items in a normal
distribution that lie between the following two z-scores.
z= -2 and z= -0.5
Click the icon to view a table of z-scores and percentiles.
O A. 30.85%
O B. 28.57%
O C. 2.28%
D. 69.15%
Expert Solution
This question has been solved!
Explore an expertly crafted, step-by-step solution for a thorough understanding of key concepts.

This is a popular solution!

Trending now
This is a popular solution!

Step by step
Solved in 2 steps with 2 images

Knowledge Booster


Learn more about
Need a deep-dive on the concept behind this application? Look no further. Learn more about this topic, algebra and related others by exploring similar questions and additional content below.Recommended textbooks for you
Glencoe Algebra 1, Student Edition, 9780079039897…
Algebra
ISBN:
9780079039897
Author:
Carter
Publisher:
McGraw Hill

Big Ideas Math A Bridge To Success Algebra 1: Stu…
Algebra
ISBN:
9781680331141
Author:
HOUGHTON MIFFLIN HARCOURT
Publisher:
Houghton Mifflin Harcourt
Glencoe Algebra 1, Student Edition, 9780079039897…
Algebra
ISBN:
9780079039897
Author:
Carter
Publisher:
McGraw Hill
Big Ideas Math A Bridge To Success Algebra 1: Stu…
Algebra
ISBN:
9781680331141
Author:
HOUGHTON MIFFLIN HARCOURT
Publisher:
Houghton Mifflin Harcourt