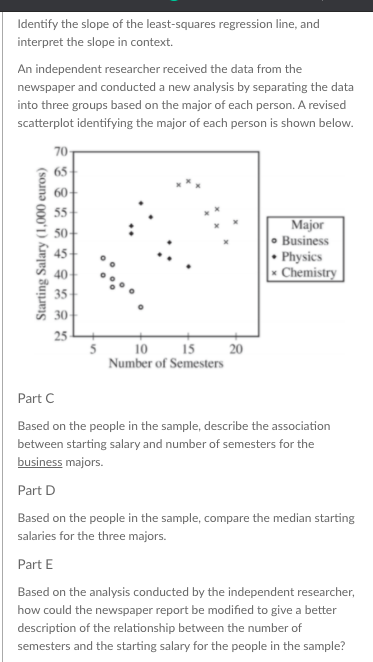
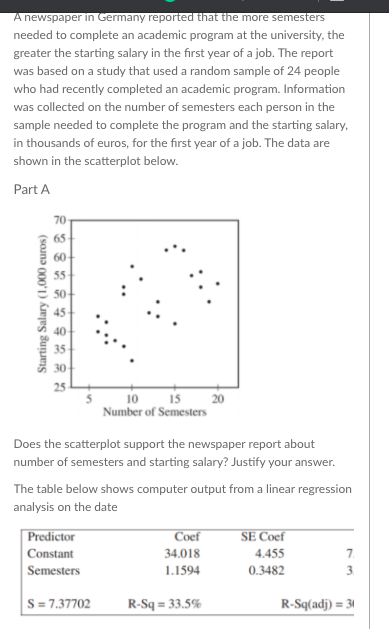
Identify the slope of the least-squares regression line, and interpret the slope in context. An independent researcher received the data from the newspaper and conducted a new analysis by separating the data into three groups based on the major of each person. A revised scatterplot identifying the major of each person is shown below.


Quadratic Equation
When it comes to the concept of polynomial equations, quadratic equations can be said to be a special case. What does solving a quadratic equation mean? We will understand the quadratics and their types once we are familiar with the polynomial equations and their types.
Demand and Supply Function
The concept of demand and supply is important for various factors. One of them is studying and evaluating the condition of an economy within a given period of time. The analysis or evaluation of the demand side factors are important for the suppliers to understand the consumer behavior. The evaluation of supply side factors is important for the consumers in order to understand that what kind of combination of goods or what kind of goods and services he or she should consume in order to maximize his utility and minimize the cost. Therefore, in microeconomics both of these concepts are extremely important in order to have an idea that what exactly is going on in the economy.
Hi could you answer the blanks for me?


Trending now
This is a popular solution!

Step by step
Solved in 2 steps


