Identify the test statistic that should be used for testing whether the average distance hit for the four brands of baseball bats differ.
Identify the test statistic that should be used for testing whether the average distance hit for the four brands of baseball bats differ.

Glencoe Algebra 1, Student Edition, 9780079039897, 0079039898, 2018
18th Edition
ISBN:9780079039897
Author:Carter
Publisher:Carter
Chapter10: Statistics
Section10.6: Summarizing Categorical Data
Problem 27PPS

Related questions
Question
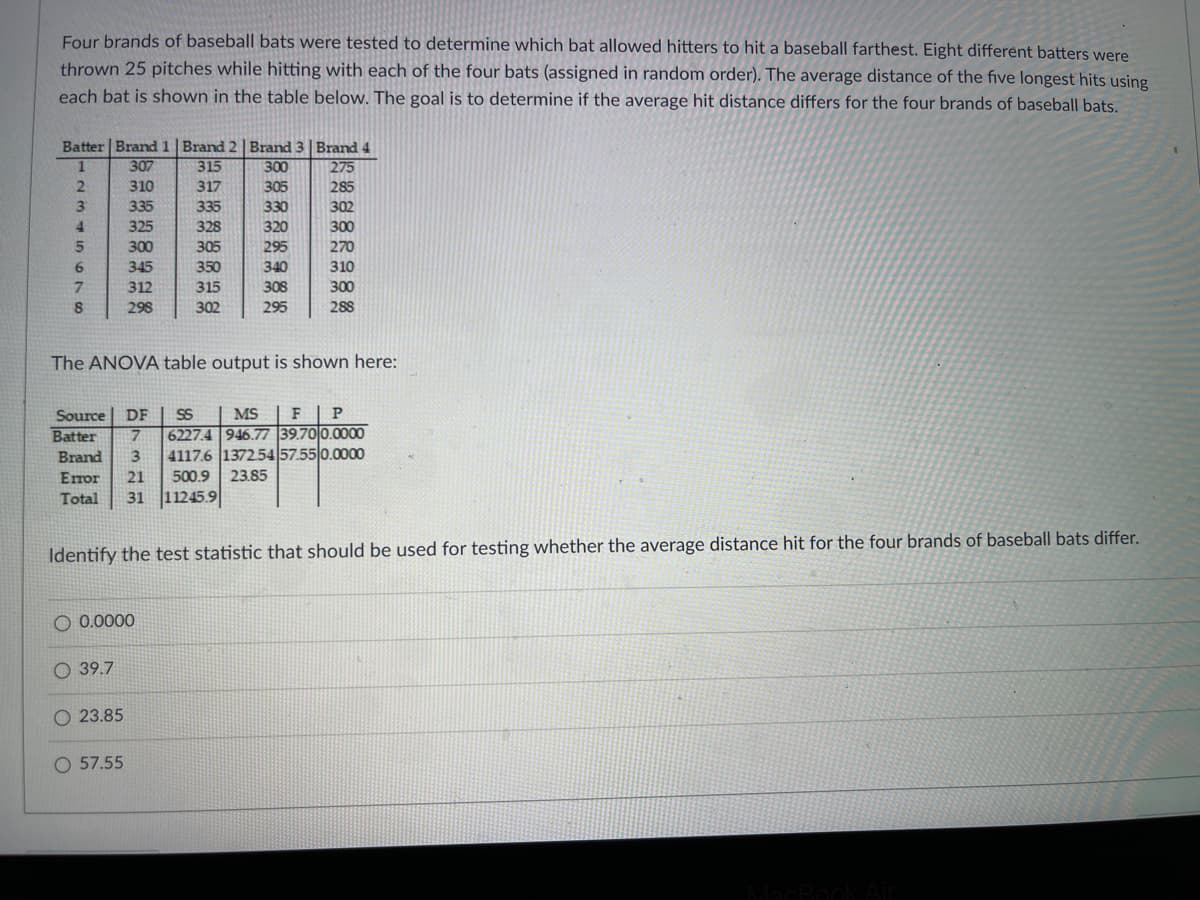
Transcribed Image Text:Four brands of baseball bats were tested to determine which bat allowed hitters to hit a baseball farthest. Eight different batters were
thrown 25 pitches while hitting with each of the four bats (assigned in random order). The average distance of the five longest hits using
each bat is shown in the table below. The goal is to determine if the average hit distance differs for the four brands of baseball bats.
Batter | Brand1| Brand 2 | Brand 3 | Brand 4
315
1
307
300
275
310
317
305
285
335
335
330
302
4.
325
328
320
300
300
305
295
270
345
350
340
310
312
315
308
300
298
302
295
288
The ANOVA table output is shown here:
F P
6227.4 946.77 39.700.0000
4117.6 1372.54 57.55 0.0000
Source
DF
MS
Batter
Brand
Error
21
500.9
23.85
Total
31
11245.9
Identify the test statistic that should be used for testing whether the average distance hit for the four brands of baseball bats differ.
O 0.0000
О 39.7
O 23.85
O 57.55
Expert Solution
This question has been solved!
Explore an expertly crafted, step-by-step solution for a thorough understanding of key concepts.

Step by step
Solved in 2 steps

Recommended textbooks for you
Glencoe Algebra 1, Student Edition, 9780079039897…
Algebra
ISBN:
9780079039897
Author:
Carter
Publisher:
McGraw Hill


Algebra & Trigonometry with Analytic Geometry
Algebra
ISBN:
9781133382119
Author:
Swokowski
Publisher:
Cengage
Glencoe Algebra 1, Student Edition, 9780079039897…
Algebra
ISBN:
9780079039897
Author:
Carter
Publisher:
McGraw Hill
Algebra & Trigonometry with Analytic Geometry
Algebra
ISBN:
9781133382119
Author:
Swokowski
Publisher:
Cengage

Holt Mcdougal Larson Pre-algebra: Student Edition…
Algebra
ISBN:
9780547587776
Author:
HOLT MCDOUGAL
Publisher:
HOLT MCDOUGAL

Elements Of Modern Algebra
Algebra
ISBN:
9781285463230
Author:
Gilbert, Linda, Jimmie
Publisher:
Cengage Learning,

College Algebra (MindTap Course List)
Algebra
ISBN:
9781305652231
Author:
R. David Gustafson, Jeff Hughes
Publisher:
Cengage Learning