If 23 more HRDs respond to the survey, which of the following is the best estimate of the number of people employed by the 23 organizations these HRDs represent? 95,907 117,965 2,206,000 3,308,780 15,379,628
If 23 more HRDs respond to the survey, which of the following is the best estimate of the number of people employed by the 23 organizations these HRDs represent? 95,907 117,965 2,206,000 3,308,780 15,379,628

MATLAB: An Introduction with Applications
6th Edition
ISBN:9781119256830
Author:Amos Gilat
Publisher:Amos Gilat
Chapter1: Starting With Matlab
Section: Chapter Questions
Problem 1P

Related questions
Question
If 23 more HRDs respond to the survey, which of the following is the best estimate of the number of people employed by the 23 organizations these HRDs represent?
95,907
117,965
2,206,000
3,308,780
15,379,628
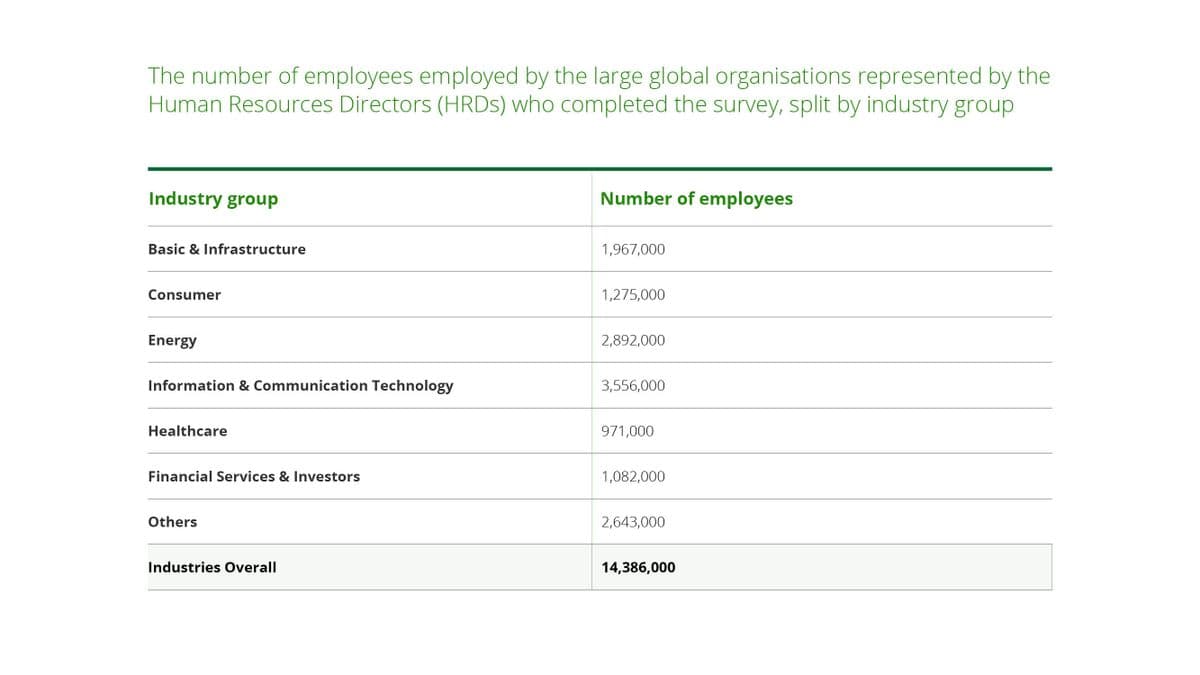
Transcribed Image Text:The number of employees employed by the large global organisations represented by the
Human Resources Directors (HRDS) who completed the survey, split by industry group
Industry group
Basic & Infrastructure
Consumer
Energy
Information & Communication Technology
Healthcare
Financial Services & Investors
Others
Industries Overall
Number of employees
1,967,000
1,275,000
2,892,000
3,556,000
971,000
1,082,000
2,643,000
14,386,000
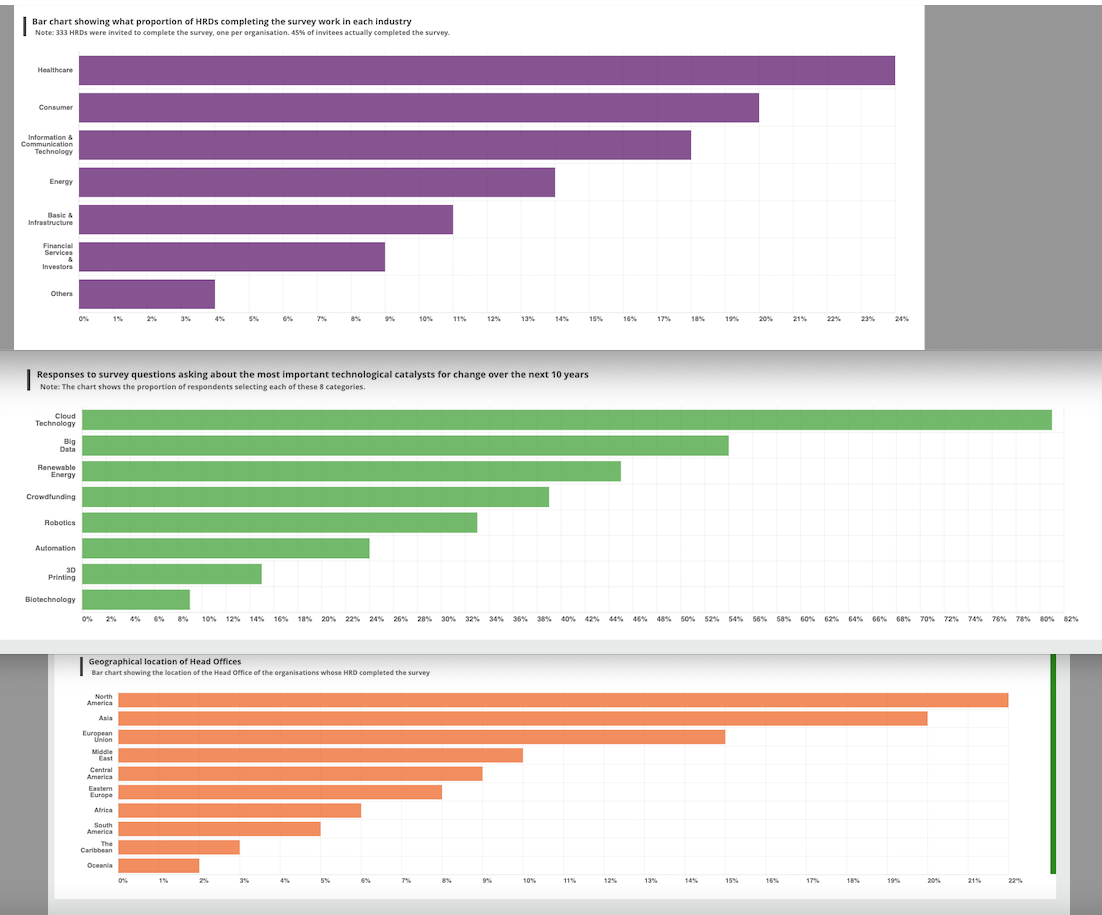
Transcribed Image Text:Bar chart showing what proportion of HRDS completing the survey work in each industry
Note: 333 HRDs were invited to complete the survey, one per organisation. 45% of invitees actually completed the survey.
Healthcare
Consumer
Information &
Communication
Technology
Energy
Basic &
Infrastructure
Financial
Services
Investors
Others
Cloud
Technology
Big
Data
Renewable
Energy
Crowdfunding
Robotics
Automation
3D
Printing
0%
Biotechnology
1%
Responses to survey questions asking about the most important technological catalysts for change over the next years
Note: The chart shows the proportion of respondents selecting each of these 8 categories.
0%
North
America
Asia
European
Union
Middle
East
Central
America
Eastern
Europe
Africa
2%
Geographical location of Head Offices
Bar chart showing the location of the Head Office of the organisations whose HRD completed the survey
South
America
The
Caribbean
Oceania
0%
6% 8%
5%
2%
8%
9%
3%
10% 11%
5%
12%
10% 12% 14% 16 % 18 % 20%
16% 18% 20% 22% 24% 26% 28% 30% 32%
28% 30% 32% 34% 36% 38% 40% 42% 44% 46%
8%
13%
9%
14%
10%
15%
11%
16%
12%
13%
17%
18%
19%
14%
20%
50% 52% 54% 56% 58% 60% 62% 64% 66% 68 % 70% 72% 74% 76% 78% 80% 82%
15%
21%
16%
17%
18%
19%
20%
21%
Expert Solution
This question has been solved!
Explore an expertly crafted, step-by-step solution for a thorough understanding of key concepts.

Step by step
Solved in 3 steps with 2 images

Recommended textbooks for you
MATLAB: An Introduction with Applications
Statistics
ISBN:
9781119256830
Author:
Amos Gilat
Publisher:
John Wiley & Sons Inc

Probability and Statistics for Engineering and th…
Statistics
ISBN:
9781305251809
Author:
Jay L. Devore
Publisher:
Cengage Learning

Statistics for The Behavioral Sciences (MindTap C…
Statistics
ISBN:
9781305504912
Author:
Frederick J Gravetter, Larry B. Wallnau
Publisher:
Cengage Learning
MATLAB: An Introduction with Applications
Statistics
ISBN:
9781119256830
Author:
Amos Gilat
Publisher:
John Wiley & Sons Inc
Probability and Statistics for Engineering and th…
Statistics
ISBN:
9781305251809
Author:
Jay L. Devore
Publisher:
Cengage Learning
Statistics for The Behavioral Sciences (MindTap C…
Statistics
ISBN:
9781305504912
Author:
Frederick J Gravetter, Larry B. Wallnau
Publisher:
Cengage Learning

Elementary Statistics: Picturing the World (7th E…
Statistics
ISBN:
9780134683416
Author:
Ron Larson, Betsy Farber
Publisher:
PEARSON

The Basic Practice of Statistics
Statistics
ISBN:
9781319042578
Author:
David S. Moore, William I. Notz, Michael A. Fligner
Publisher:
W. H. Freeman

Introduction to the Practice of Statistics
Statistics
ISBN:
9781319013387
Author:
David S. Moore, George P. McCabe, Bruce A. Craig
Publisher:
W. H. Freeman