If a family has four children, is it more likely they will have - two boys and two girls (OPTION A) or - three of one sex and one of another (OPTION B)? Assume that the probability of a child being a boy is 0.5 and that the births are independent events. O Option A Option B
If a family has four children, is it more likely they will have - two boys and two girls (OPTION A) or - three of one sex and one of another (OPTION B)? Assume that the probability of a child being a boy is 0.5 and that the births are independent events. O Option A Option B

Holt Mcdougal Larson Pre-algebra: Student Edition 2012
1st Edition
ISBN:9780547587776
Author:HOLT MCDOUGAL
Publisher:HOLT MCDOUGAL
Chapter11: Data Analysis And Probability
Section11.8: Probabilities Of Disjoint And Overlapping Events
Problem 2C

Related questions
Question
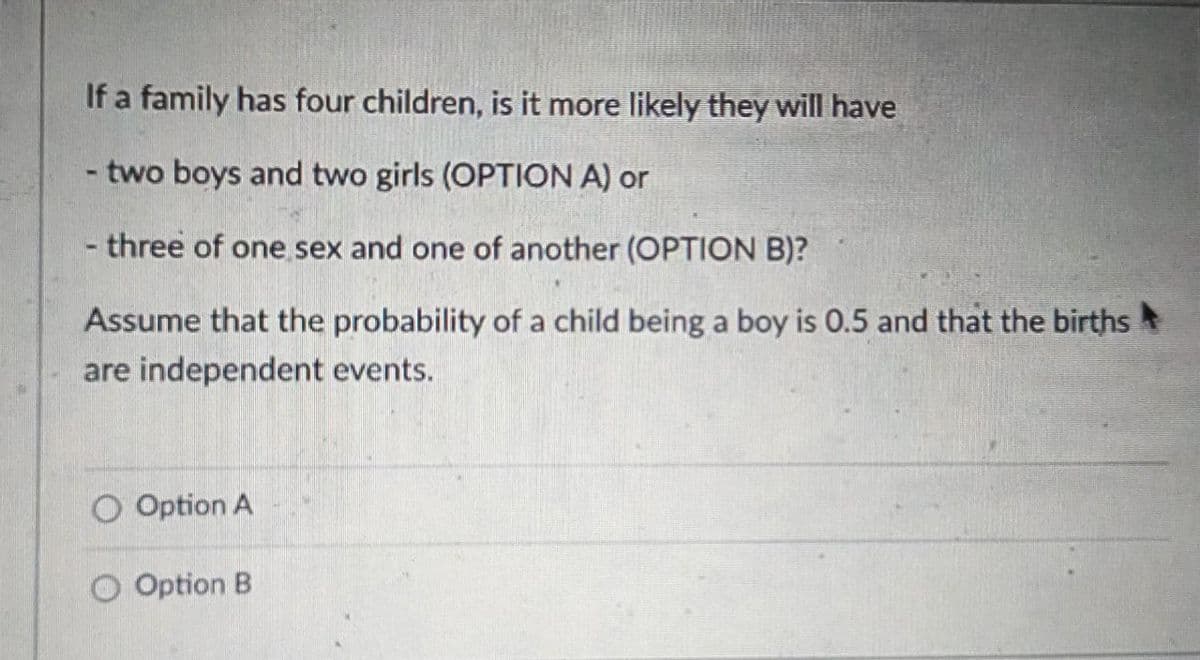
Transcribed Image Text:If a family has four children, is it more likely they will have
two boys and two girls (OPTION A) or
- three of one sex and one of another (OPTION B)?
Assume that the probability of a child being a boy is 0.5 and that the births
are independent events.
O Option A
Option B
Expert Solution
This question has been solved!
Explore an expertly crafted, step-by-step solution for a thorough understanding of key concepts.

Step by step
Solved in 2 steps

Recommended textbooks for you
Holt Mcdougal Larson Pre-algebra: Student Edition…
Algebra
ISBN:
9780547587776
Author:
HOLT MCDOUGAL
Publisher:
HOLT MCDOUGAL
Holt Mcdougal Larson Pre-algebra: Student Edition…
Algebra
ISBN:
9780547587776
Author:
HOLT MCDOUGAL
Publisher:
HOLT MCDOUGAL