If the area under the Standard Normal ourve and to the left of z-soore le 1, then the z-score value is O Positive and close to zero. Very large positive value. Negative and close to zero. O Very large negative value.
If the area under the Standard Normal ourve and to the left of z-soore le 1, then the z-score value is O Positive and close to zero. Very large positive value. Negative and close to zero. O Very large negative value.

MATLAB: An Introduction with Applications
6th Edition
ISBN:9781119256830
Author:Amos Gilat
Publisher:Amos Gilat
Chapter1: Starting With Matlab
Section: Chapter Questions
Problem 1P

Related questions
Question
J 1
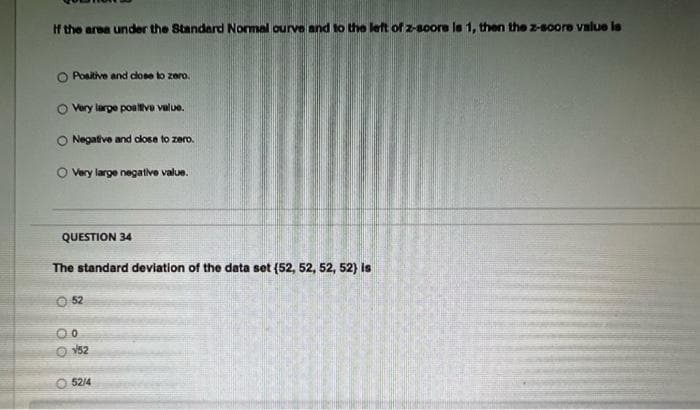
Transcribed Image Text:If the area under the Standard Normal ourve and to the left of z-score la 1, then the z-score value is
O Positive and close to zero.
O Very large positive value.
O Negative and close to zero.
O Very large negative value.
QUESTION 34
The standard deviation of the data set (52, 52, 52, 52) is
052
00
OV/52
O O O
52/4
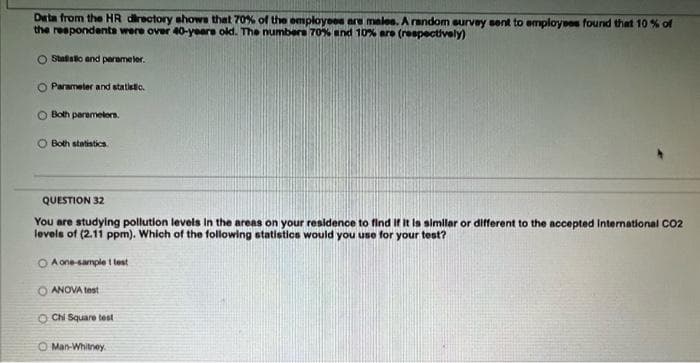
Transcribed Image Text:Data from the HR directory shows that 70% of the employees are males. A random survey sent to employees found that 10 % of
the respondents were over 40-years old. The numbers 70% and 10% are (respectively)
Staatio and parameter.
O Parameter and statistic.
Both parameters.
Both statistics.
QUESTION 32
You are studying pollution levels in the areas on your residence to find if it is similar or different to the accepted International CO2
levels of (2.11 ppm). Which of the following statistics would you use for your test?
OA one-sample 1 test
ⒸANOVA test
Chi Square test
Man-Whitney
Expert Solution
This question has been solved!
Explore an expertly crafted, step-by-step solution for a thorough understanding of key concepts.

Step by step
Solved in 2 steps

Recommended textbooks for you
MATLAB: An Introduction with Applications
Statistics
ISBN:
9781119256830
Author:
Amos Gilat
Publisher:
John Wiley & Sons Inc

Probability and Statistics for Engineering and th…
Statistics
ISBN:
9781305251809
Author:
Jay L. Devore
Publisher:
Cengage Learning

Statistics for The Behavioral Sciences (MindTap C…
Statistics
ISBN:
9781305504912
Author:
Frederick J Gravetter, Larry B. Wallnau
Publisher:
Cengage Learning
MATLAB: An Introduction with Applications
Statistics
ISBN:
9781119256830
Author:
Amos Gilat
Publisher:
John Wiley & Sons Inc
Probability and Statistics for Engineering and th…
Statistics
ISBN:
9781305251809
Author:
Jay L. Devore
Publisher:
Cengage Learning
Statistics for The Behavioral Sciences (MindTap C…
Statistics
ISBN:
9781305504912
Author:
Frederick J Gravetter, Larry B. Wallnau
Publisher:
Cengage Learning

Elementary Statistics: Picturing the World (7th E…
Statistics
ISBN:
9780134683416
Author:
Ron Larson, Betsy Farber
Publisher:
PEARSON

The Basic Practice of Statistics
Statistics
ISBN:
9781319042578
Author:
David S. Moore, William I. Notz, Michael A. Fligner
Publisher:
W. H. Freeman

Introduction to the Practice of Statistics
Statistics
ISBN:
9781319013387
Author:
David S. Moore, George P. McCabe, Bruce A. Craig
Publisher:
W. H. Freeman