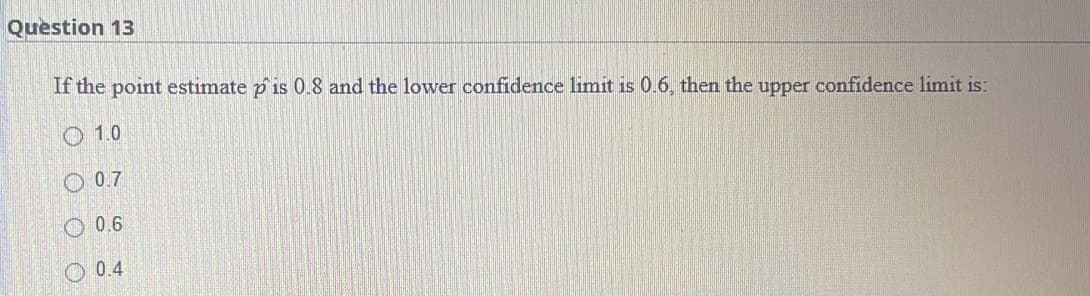
If the point estimate p'is 0.8 and the lower confidence limit is 0.6, then the upper confidence limit is: 1.0 0.7 0.6 0.4


Q: Wipe you findinion's Calendare de expected ste el veran el aument Expl mees Ah 1.5, the expected
A: Hi thank you for posting this question as per follow up we have answer question four for you,…
Q: a. Fill in the following frequency table using the data. Dividend Yield 2.5 to <3.0 3.0 to <3.5 3.5…
A: Answer:- Given data table,
Q: Jenny did a survey in her statistics class and found that 15 out of 24 study in the Learning Center…
A: Given that Jenny did a survey in her statistics class and found that 15 out of 24 study in the…
Q: ___________ are often used to exemplify the differences between groups. Question 9 options:…
A: The answer is :
Q: In 2004 it surfaced in Reader's Digest presented as having unnamed community college. Four students…
A: Given The number of students who walked halfway through the history test =4 The total number of…
Q: Distance (m) Signal Strength (dBm) 5 10 15 20 25 -70 -75 -78 -80 -90
A: Given data: Distance (m) Signal Strength (dBm) 5 -70 10 -75 15 -78 20 -80 25 -90
Q: Engineers must consider the breadths of male heads when designing helmets. The company researchers…
A:
Q: (a) For this data, find the value of the Pearson's product-moment correlation coefficient, r.…
A: Data is given for Eduardo belief : He take data of 8 males n= 8 Eduardo believes that x(years)…
Q: 5. Cn ← → oor to find new sample size or standard deviation. a. If standard deviation is to become…
A:
Q: An auditor wishes to estimate the mean value of accounts receivable in a total population of 1,120…
A: Given information: The population size, N=1120, and the margin of error is $4.
Q: Given the least squares regression line y = - 26+1.5x,and a coefficient of determination of o.25,…
A: Given The least square regression line is as follows: y^=-26+1.5x Coefficient of determination,…
Q: Identify which graphical display might be appropriate in the given case. Select all that apply.…
A: As there are 10 big conferences and many football teams scored so Scatterplot should be the best…
Q: You are a researcher studying the lifespan of a certain species of bacteria. A preliminary sample of…
A: It is given that Confidence level = 95% Margin of error E = 0.6 Population SD = 6 The critical…
Q: How do I find the relative frequency given the information I received. Lower Class Limit Upper…
A: Given that Lower Class Limit Upper Class Limit Frequency 15 25 17 26 36 42 37 47 68…
Q: 5. Suppose X = ln(Y) where X N(μ, o²). Find the PDF for Y.
A: Solution
Q: What is the new mean value if the instructor does each of the following? Adds 10 points to each…
A: Given that Mean=E(X)=12
Q: The following table shows the results of two random samples that measured the average number of…
A: Solution: Given information: n1=17 Sample size of Li-ion n2= 14 Sample size of NiMH
Q: time to maturation of 80.5 days, with a standard deviation of 2.5 days. W. Make a density curve of…
A: Let X be the random variable that the time to maturation. Given that, X ~ N(μ=80.5, σ=2.5) To plot a…
Q: Scene: The senior talent show is scheduled to take place this afternoon. Michael Senatore is in…
A: As per our guidelines we are supposed to answer only 3 subparts of any questions so i am solving…
Q: Assuming the population has an approximate normal distribution, if a sample size n = 12 has a sample…
A: GivenMean(x)=47standard deviation(s)=6sample size(n)=12confidence level=98%
Q: Assume that a sample is used to estimate a population mean . Find the margin of error M.E. that…
A: We have given that Sample size (n) = 14Sample mean (x̅) = 76.2Standard deviations (s) =…
Q: The boxplot below shows salaries for Actuaries and CPAs. + 20 CPA Actuary 30 + 50 40 60 Salary…
A: We have given the following box-plot
Q: a) Suppose X, Y and Z are uncorrelated random variables with means 1, 2 and 3 and standard…
A: Given that V(X)=2, V(Y)=4, V(Z)=5
Q: If 99 people had a mean income of $12,500, how much is the mean income increased by the addition of…
A: Given data : Mean income of 99 people = 12500 Increase in mean income by adding a single…
Q: You measure 24 randomly selected textbooks' weights, and find they have a mean weight of 31 ounces.…
A: Given that Sample size (n)=24 Sample mean (x̄)=31 Population standard deviation (σ)=12.4 We have to…
Q: A travel magazine conducts an annual survey where readers rate their favorite cruise ship. Ships are…
A:
Q: tool used to describe a linear or a non linear relationship between one or more predictor variables…
A: Given that Regression analysis is a statistical tool used to describe a linear or a non linear…
Q: Implement a test to compare the percentage of hens whose pancreatic secretions increased (post -…
A: Given: In this, we have to test whether the pancreatic secretions increased in post time from pre…
Q: In the year 1999, a survey was undertaken to find the salary of employees working in software…
A:
Q: The pooled sample proportion is given by: n1 = 677 A) 0.163 X₁ + X₂ n₁ + 1₂ Quick Quiz: Assume that…
A: Given that n1=677, n2=3377, x1=172, x2=654
Q: 12:43 : ..|| 31%. 1. What are the hypotheses you should use to determine whether a population mean…
A: We have given that Population mean μ =17 NOTE:- According to bartleby guidelines expert can solve…
Q: (b) The computed F-statistic for determining if region has an effect on worth of billionaires is…
A: Given information: Region Count Average Standard Deviation USA n1=28 x¯1=5.096 s1=2.7932 Asia…
Q: two types of metals . On the fourth RFID accuracy test, the prototype is tested to see if it would…
A: For statistical treatment of the data, you can perform a simple analysis of the accuracy and success…
Q: What percentage to the nearest hundredth of children are born from pregnancies lasting more than 274…
A: Let X be the random variable for the lengths of pregnancies of women. Given that, X~N(μ=266, σ=16)…
Q: 6) A survey was done to determine if the Cholesterol level of Americans was different than that of…
A: Given Country U Sample size, n1=44 Sample mean, x¯1=179.6 Sample sd, s1=7.7 Country C Sample size,…
Q: The test statistic of z = - 2.79 is obtained when testing the claim that p< 0.29. a. Using a…
A: The question is about hypo. testing Given : Test stat ( z ) = -2.79 Claim : p < 0.29 To find :…
Q: The sunshine list mid-level bureaucrat depicted has a commute from a suburban home to a midtown…
A: Please note that as per our guidelines if multiple sub-parts are there in a question we can answer…
Q: 8-10 10-12 Table 1.30 Researcher B 12 11 4 0.08 0.07 0.03 0.90 0.97 1 24. Give a reason why the data…
A: Yes.
Q: How much will the investor (A=5) invest in T-bills, asset T, and asset D.
A: To determine the optimal allocation for the investor, we can use the mean-variance optimization…
Q: Consider the following ordered data. 12 15 15 16 17 17 18 19 20 (a) Find the low, Q1, median, Q3,…
A: Given data: 12, 15, 15, 16, 17, 17, 18, 19, 20
Q: According to an estimate, 65% of adults in the United States have at least one credit card. If a…
A: Given that Number of trials n=30 Success of probability p =65%=0.65 X~bin(n,p) nCx = n!/x!(n-x)!…
Q: An aircraft seam requires 23 rivets. The seam will have to be reworked if any of these rivets is…
A: Hi thank you for posting this question, since you have posted multiple questions we have answer…
Q: The boxplots below shows salaries for Construction workers and Teachers. Construction Teacher 22 23…
A: As per our guidelines we are supposed to answer only one question per post so i am solving first…
Q: A linear regression model for the revenue data for a company is R=27.0t+205 where R is total annual…
A: The regression equation is R=27.0t+205.
Q: Using the information in the screenshot, can you please calculate the measures of spread
A: Given information: Month Production of Dairy products(x) January 107.3 February 110.6 March…
Q: In Wilcoxon Signed Rank Sum Test, we use ___________ as test statistic. a.
A: A Wilcoxon Signed Rank Sum Test is a non-parametric test used to compare two dependent samples…
Q: 1. The following table fives the amount of baggage fees charges to passengers in 2010 by the top 20…
A: From the provided information, Sample size (n) = 20 Arranging the data into ascending order:…
Q: Given X=90.6,μ=88.9, and σ=3.4, indicate on the curve where the given Xvalue would be.
A:
Q: Mars, Inc. says that the mix of colors in its M&M'S® Milk Chocolate Candies from its Hackettstown,…
A: Since you have posted a question with multiple sub-parts, we will provide the solution only to the…
Q: 12) The distribution of weights of dogs in Fisherville is skewed left with a mean weight of 25…
A: 12) Given that μ=25. Let σ denote the standard deviation of the distribution of weights of dogs in…
13

Step by step
Solved in 3 steps
