Wipe you findinion's Calendare de expected ste el veran el aument Expl mees Ah 1.5, the expected


Q: Suppose x is a random variable best described by a uniform probability distribution with c = 7 and d…
A: Hey there! Thank you for posting the question. Since your question has more than 3 parts, we are…
Q: Q1: As a project foe his statistics elass in Spring 2001, Ahmsd was supposed to tako a TAikom sample…
A: Given information: A random sample of 30 cars in the student parking lot is given.
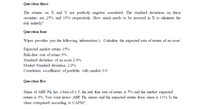
Q: The pmf of the amount of memory X (GB) in a purchased flash drive is given as the following. 1 4 8…
A: Solution
Q: Consider randomly selecting a student at a certain university, and let A denote the event that the…
A:
Q: (b) Consider the process {Xt}, Xt = Σ₁0 t-j where j= Et iid(0, ²).
A: Given that Et ~ iid(0,?2)
Q: N₂(μ, E) with μ = (2, 2)' and Σ = 01 vectors A = (1, 1), B = (1,−1). Show that AX and BX are…
A:
Q: The data is available at Weather in Hamilton in January 2020 (Ontario) - Detailed Weather Forecast…
A: Let us consider the central tendency measures as mean, median and mode: Let us denote X as the…
Q: Question 2 Correlation equals causation True False
A: “Since you have asked multiple questions, we will solve the first question for you. If you want any…
Q: 3. The manager asked to assess the viability of future development projects and select the most…
A:
Q: Brown, Jerry Bruckheimer, J. K. Rowling, and Tom Cruise. Can this "Top 10" list be used to learn…
A: The data is given on the earnings of the 10 highest incomes of celebrities in a recent year.
Q: Household 1 2 3 4 5 6 7 8 9 10 No. of Persons in Household 3 5426WNSNa 3 No. of Physician Visits Per…
A: Given information: The data for the number of physician visits per person during the previous year…
Q: b. What is the probability that a student will complete the exam in more than 60 minutes but less…
A: Given that. X~N( μ , ?) μ=80 , ?=10 Z-score =( x - μ )/?
Q: The 2008 EPA fuel economy ratings for both highway and city driving are given for 25 randomly…
A: Hello according to our honor code can answer one question at a time, Please find the solution to the…
Q: C. 3. X P(X) Consider the probability distribution shown here. 0 0.3 1 0.3 2 0.4 a. When you draw a…
A: Given: X P(X=x) 0 0.3 1 0.3 2 0.4 Population size=3
Q: The height (in inches) and weight (in pounds) of 21 randomly selected baseball players are in the le…
A: Given information: The height and weight of 21 basketball players are given.
Q: The following data are taken from an experiment in which the subjects were tested for motion…
A:
Q: Waiting times (in minutes) of customers at a bank where all customers enter a single waiting line…
A: From the provided information, The data values for Bank B are as follow: 4.4, 5.5, 5.9, 6.2, 6.7,…
Q: Description of item analysis
A: Introduction Statistics is a field which involves collection, arrangement and analysis of the data…
Q: The following data was reported on total Fe for four types of iron formation (1= carbonate, 2=…
A: Given data: 1 20.3 28.1 27.8 27 27.7 25.2 25.3 27.1 20.5 31.5 2 26.4 24 26.2 20.2 23.5 34 17.1…
Q: Question 1) Suppose that T follows a t distribution with r = 15 degrees of freedom. Find the…
A: Note: Hey there! Thank you for posting the question. Since your question has more than 3 parts, we…
Q: A power analysis is important for which important step in research Group of answer choices a…
A: Solution:- Given that A power analysis An a priori power analysis is a type of statistical…
Q: The following data are taken from a study conducted by the National Park System on the temperatures…
A: Solution:- Given that the data histogram is given and corresponding rcode is x <- c(142, 156,…
Q: According to Mars, Incorporated, 20.5% of the M&M'S® Milk Chocolate Candies made at its Cleveland…
A: As per our guidelines we are supposed to answer only one question and 3 subparts of the same…
Q: What is the probability that the proportion of the people from Fisherville have a cell-phone and the…
A: Let p1 be the population proportion of the residents in Fisheville who own a cell phone. p2 be the…
Q: 7. Make a pictograph to represent the categorical data in the following table representing the…
A: Pictograph to represent the categorical data : Bar graph is best Pictograph to represent the…
Q: Goldilocks Effect: Read to Your Kids! The American Academy of Pediatrics recommends that parents…
A: Given that, In the study, 27 four- year-olds were presented with stories in three different…
Q: Goldilocks Effect: Read to Your Kids! The American Academy of Pediatrics recommends that parents…
A: Explanatory variables are independent variables which is used to predict the response variable or…
Q: what errors can occur in a factorial design when using two or more independents
A: Introducing more independent variables can make the system needlessly complex .
Q: You are a researcher studying the lifespan of a certain species of bacteria. A preliminary sample of…
A: It is given that Confidence level = 95% Margin of error E = 0.6 Population SD = 6 The critical…
Q: a. Describe this probability distribution. Be sure to check the appropriate conditions. b. What is…
A: Solution:
Q: . D 1 2 3 # 5 5 7 3 9 5 1 2 3 4 5 5 7 3 9 D 1 2 Member of the Baseball Hall of Fame P 2 P P 1 P H 1…
A: Note: Hi! Thank you for the question, As per the honor code, we are allowed to answer three…
Q: . Assume Z~N(0, 1), find the area of the following:
A: Given Information: The variable Z follows a standard normal distribution with a mean of 0 and a…
Q: standard form is Z= (X-E(X)) / sigma where sigma^2 = Var(X). Compute Var(Z).
A: Given that Standard form Z=(X-E(X))/sigma Z=(X-µ)/σ E(X)=µ, Sigma=σ, Sigma2=σ2=Var(X)
Q: The following data are taken from a study conducted by the National Park System on the temperatures…
A: Data given 142,156,168,174,181,178,179,179,174,178,163,167,153,145
Q: Using this table, what is the probability that a student chosen at random from among all first-year…
A: As per our guidelines I can only only first one question. Kindly post the remaining question again.
Q: 5. Between 1.24 and 2.78
A: Given that We have to find the area between 1.24 and 2.78
Q: Out of 600 people sampled, 228 had kids. Based on this, construct a 90% confidence interval for the…
A: The following information is given Sample size n=600 Number of kids x= 228 Proportion p^=228600=0.88…
Q: The following graph represents the results of a survey, in which a random sample of adults was asked…
A: Introduction A bar graph shows the frequency count of the data.
Q: A simple random sample of size n = 49 is obtained from a population with mean 80 and standard…
A: Given that Sample size=n=49, Populations mean=M=80, Populations standard deviations=Sd=14 Note:…
Q: Consider the pairs of observations listed below. Which of the following values represents the…
A: Given data: x y 1 6 3 5 4 14 5 12 7 12
Q: A random sample of packets of cereals is collected to check whether the machine is working…
A: Given: Mean=499g Variance, S2=9g
Q: 12) The distribution of weights of dogs in Fisherville is skewed left with a mean weight of 25…
A: 12) Given that μ=25. Let σ denote the standard deviation of the distribution of weights of dogs in…
Q: To get an unbiased sample variance, we divide by instead of which would give us a estimate of the…
A: Introduction The variance is a measure of dispersion.
Q: The manager of the customer service division of a consumer electronics company is interested in…
A: Categorical data are values that are used to label groups or categories like gender, nationality,…
Q: In your calculus class, your final grade is based on four categories. The categories are tests,…
A: Hey there! Thank you for posting the question. Since there are multiple questions posted, we will…
Q: 1a. If the parameter is 5.5, which sampling distribution are unbiased? Why? 1b. Which of the…
A: Introduction The parameter is a no. which describes an entire population.
Q: Use the magnitudes (Richter scale) of the 120 earthquakes listed in the accompanying data table. Use…
A: Introduction The measures of variation gives an idea about the spread of the data.
Q: ſhe distribution of the number of children in a household is strongly skewed right. Most households…
A: Central limit theorem: As sample size increases, the sampling distribution of sample mean follows…
Q: construct a frequency distribution for the data construct a histogram check for outliers calculate…
A: The data is given on the no. of branches of the 50 top banks. To construct a frequency distribution…
Q: Consider the list of numbers 2,3,4. The following table includes the 9 possible combinations of…
A: Given that: Sample Sample mean, x¯ 2,2 2 2,3 2.5 2,4 3 3,2 2.5 3,3 3 3,4 3.5 4,2 3…

Step by step
Solved in 2 steps

