If the probability that an event will happen is 0.27, what is the probability that the event won't happen? 0.73 1.73 0.83 0.23 0.63
If the probability that an event will happen is 0.27, what is the probability that the event won't happen? 0.73 1.73 0.83 0.23 0.63

Holt Mcdougal Larson Pre-algebra: Student Edition 2012
1st Edition
ISBN:9780547587776
Author:HOLT MCDOUGAL
Publisher:HOLT MCDOUGAL
Chapter11: Data Analysis And Probability
Section11.9: Independent And Dependent Events
Problem 3C

Related questions
Question
Please answer this quickly! Thank you!
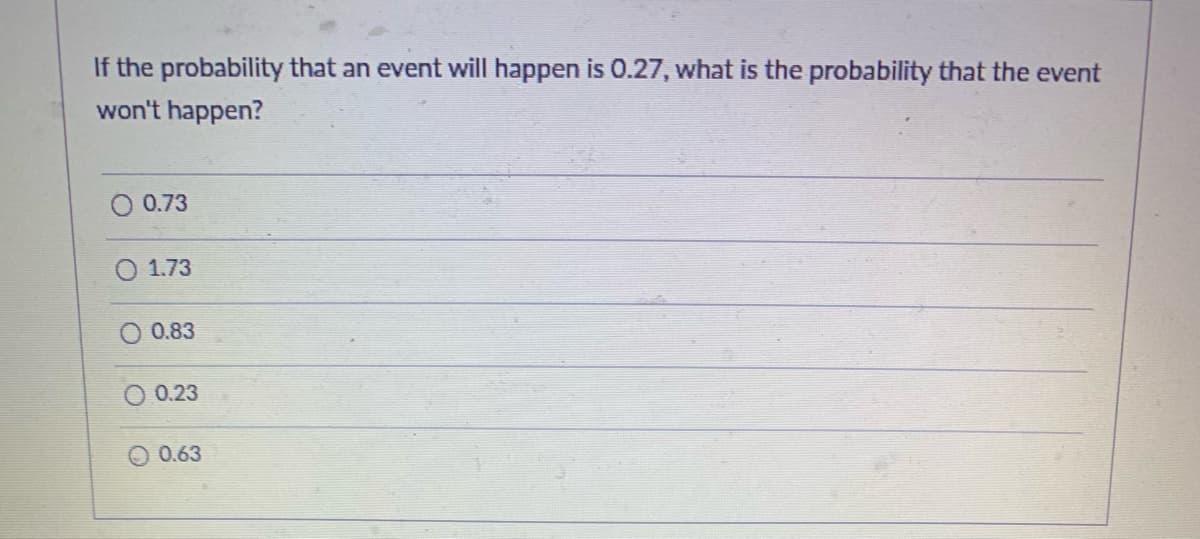
Transcribed Image Text:If the probability that an event will happen is 0.27, what is the probability that the event
won't happen?
O 0.73
O 1.73
0.83
O 0.23
0.63
Expert Solution
This question has been solved!
Explore an expertly crafted, step-by-step solution for a thorough understanding of key concepts.

This is a popular solution!

Trending now
This is a popular solution!

Step by step
Solved in 3 steps

Recommended textbooks for you
Holt Mcdougal Larson Pre-algebra: Student Edition…
Algebra
ISBN:
9780547587776
Author:
HOLT MCDOUGAL
Publisher:
HOLT MCDOUGAL

Holt Mcdougal Larson Pre-algebra: Student Edition…
Algebra
ISBN:
9780547587776
Author:
HOLT MCDOUGAL
Publisher:
HOLT MCDOUGAL