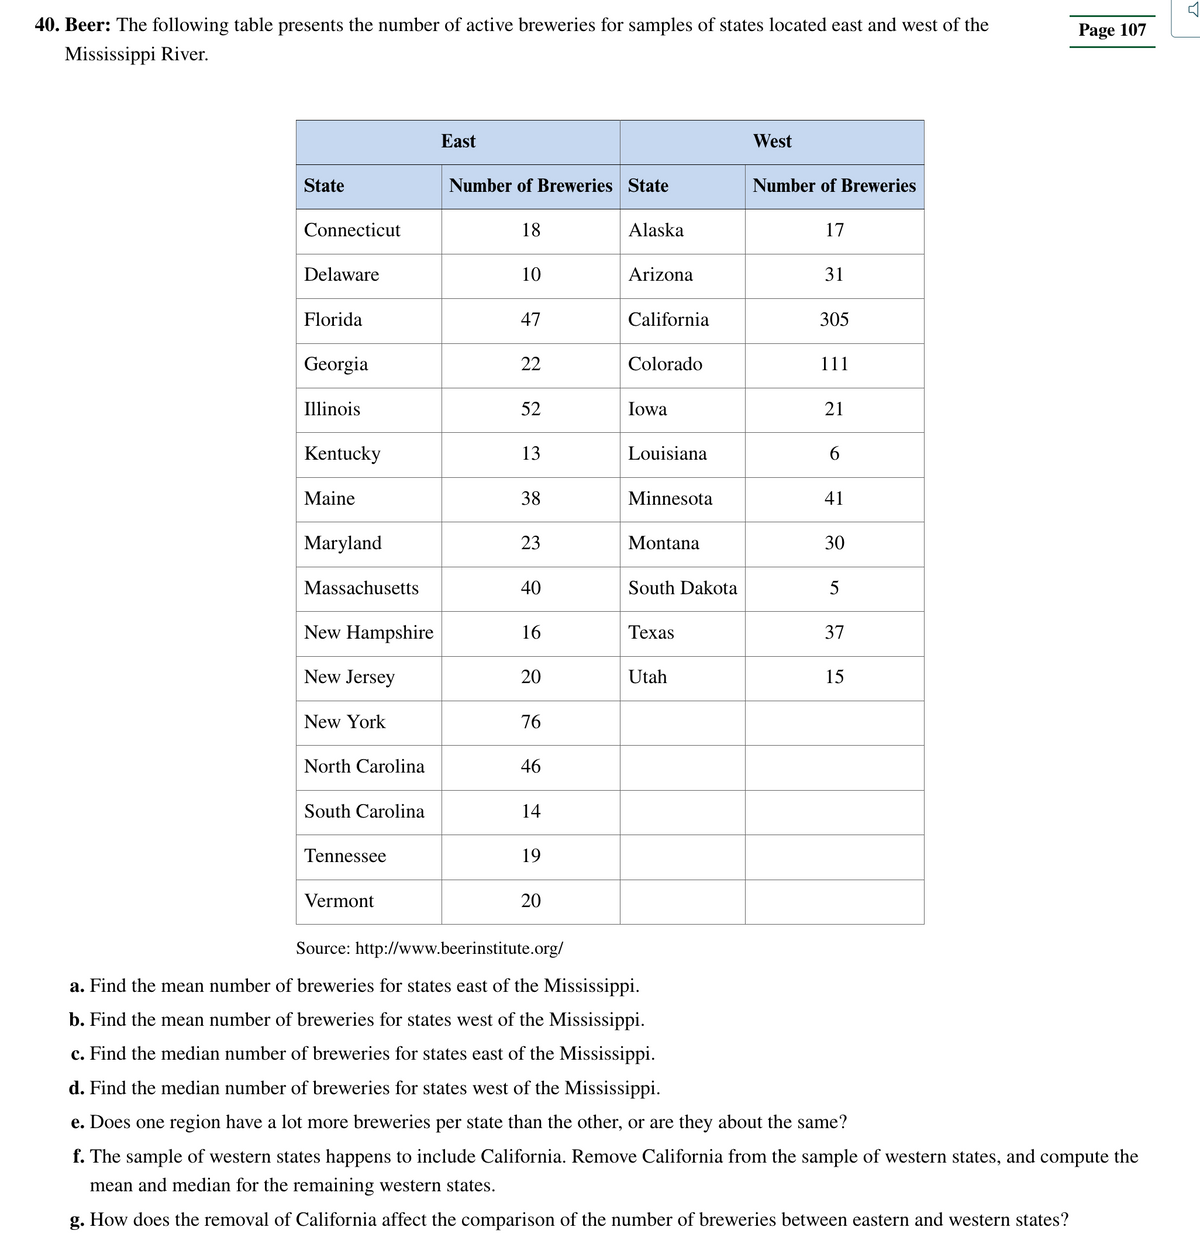
40. Beer: The following table presents the number of active breweries for samples of states located east and west of the Mississippi River. State Connecticut Delaware Florida Georgia Illinois East Number of Breweries State 18 10 47 22 52 Alaska Arizona California Colorado Iowa West Number of Breweries 17 31 305 111 21 Page
Q: 130 adults with gum disease were asked the number of times per week they used to floss before their…
A: It is given that 130 adults with gum disease were asked the number of times per week they used to…
Q: Discuss how correlation and analysis of multiple sources of data can impact organizational…
A: The data refers to the collection of information which is used for analysis.
Q: A community may be considered sociologically healthier the more variability there is in its housing…
A:
Q: 73 60 65 69 69 67 65 62 70 64 63 75 72 60 67 63 64 67 65 68 Construct Tally Sheet Frequency…
A: To construct a tally sheet and frequency distribution table for the given height data, we first need…
Q: Determine the absolute error deviation and percentage error in the calculation of R where R = In ()…
A: In this problem, a mathematical expression has been given for computing R using measured values of…
Q: This graph provides the lower tail probabilities for the standard normal distribution. Change the…
A: The objective is to obtain the value in the standard normal distribution, such that the area to the…
Q: Which single measure of central tendency-mean, median, or mode- would you say best describes the…
A: 7.116.927.037.056.965.215.217.076.9883.2
Q: Xn from Consider the testing problem where we have observed a random sample £₁, the model X₁,..., Xn…
A: In this problem we are performing hyposthesis testing on distribution for testing For the test we…
Q: Suppose that 45 students were asked how many courses they were taking this semester. The…
A: There are totally 45 students in the semester and missing values table is given
Q: An instructor has given a short quiz consisting of two parts. For a randomly selected student, let X…
A: Solution-:Let, X= The number of points earned on the first part Y=The number of points earned on…
Q: 11. FREE RESPONSE 1. The table below summarizes combined city/highway fuel econ- y for new cars…
A: NMeanStdevSEmeanTRmeanMinMedianMax6519.63.360.41719.51417192128
Q: Three different people take simple random samples of size 400 from a box of 100,000 tickets, each…
A: Three different people take simple random samples of size 400 from a box of 100,000 tickets, each…
Q: se the following values to determine the mean % Vitamin C in a sample. The values are already…
A: we calculate the average of the given values:21.64%, 21.59%, 21.67%, 21.68%Mean: (21.64 + 21.59 +…
Q: In a regression analysis involving 18 observations and 4 independent variables, the following…
A: Sample size Multiple R = 0.6000R Square = 0.3600Standard error = 4.80000
Q: A fish tank contains 17 goldfish, 3 angelfish, and 5 guppies. If a fish is selected at random from…
A:
Q: (b) Batu Pahat municipality rents bicycles for public use, which is open for 12 hours a day, has the…
A: P(X=k)=
Q: K The English department has the faculty to offer 12 sections in any combination of the three…
A: To apportion the sections using the Hamilton method,
Q: Assessment 2 Directions: 1. Using the information you gathered for Assessment 1, calculate the…
A: The summary of the data set has been studied using some measures. They are central tendency and…
Q: The sample size n, probability of success p, and probability of failure q are given for a binomial…
A: n=16,p=0.92,q=0.08n = sample sizep = probability of successq = probability of failurebinomial…
Q: If investors want portfolios with small risk (variance), should they look for investments that have…
A:
Q: Determine the null and alternative hypotheses. Ho: P H₁: P (Type integers or decimals. Do not…
A:
Q: Use the given degree of confidence and sample data to construct a confidence interval for the…
A: Solution-:Given data: 88.0,84.1,74.9,83.2,83.7,85.5We want to determine a 90% C.I. for the mean…
Q: Answer the following. A. Is there a relationship between the scores of students in quiz 1 and quiz…
A: Regression analysis is a procedure used to determine the relationship between two variables. It is…
Q: a. What would be the most likely distribution of House seats? Republicans, Democrats b. The maximum…
A: Given that,No. of representatives = 10Population size = 14 millionPercent of republican = 40%Percent…
Q: 1. A batch of 10 rocker cover gaskets contains 4 defective gaskets. If we draw samples of size 3…
A: There is total 10 rocket cover gaskets, among which 4 are defective gaskets.
Q: What is the probability that there are between 26 and 35 messages in the next hour? 2. What is the…
A: You and your friends have a large messaging group on GroupMe. The number of messages that are…
Q: You are hired to study the statistical relationship between the number of trees and the number of…
A: To start with, we will define neighborhoods in a city or use pre-existing definitions (based on PIN…
Q: Evaluate the following formula for P, = 0.3, P₂=0.9, P₁-P₂=0, p=0.814232, q=0.110307, n, -80, and n₂…
A: z test statistic = ?
Q: na test of the effectiveness of garlic for lowering cholesterol, 64 subjects were treated with raw…
A: Sample size=n=64
Q: 1. Getting a good night's sleep is essential for teenage students to perform optimally during…
A: a) Here are the null and alternative hypotheses stated :Null hypothesis (H₀): The population mean…
Q: n two different graphs, draw a positive and negative skewed curve and label with the appropriate…
A: To draw a graph for positive and negative skewed curves.
Q: 17. In a Mathematics competition, the marks obtained by team A and team B in the 10 rounds an shown…
A: The data for the marks of the two teams are given.
Q: 4. Suppose b₁ is the least squares estimator of the slope coefficient in a regression of Y on X and…
A: The regression equation is used to predict the variables based on the independent and dependent…
Q: 86 14 620 51 0 60 209 40 184 0 2 54 hat requirements must be satisfied? Select all that apply. A. At…
A: If the population is normally distributed then the sampling distribution is also normally…
Q: In order to estimate the average time spent per student on the computer terminals at a local…
A: sample size(n) = 81population standard deviation = 1.5 hoursstandard error for mean = ?
Q: Complete parts (a) and (b) below. The number of dogs per household in a small town Dogs 0 3 1 2 4 5…
A: The probability distribution for the number of dogs per household in a small town is given.
Q: A Human Resources specialist found that 705 of 1,600 employees at a particular company were pleased…
A: 1. Determine the number of employees in the lowest 30%: - Calculate 30% of 400: 0.3 * 400 = 120…
Q: What is one biological interpretation of this relationship between duration and distance ? What % of…
A: What two null hypotheses are being tested with the output shown aboveH0 : b =0H1 : b ≠0What…
Q: Use a number between 0 and 1. Round using 2 decimal places) A box contains 2 red marbles and 8 blue…
A: To find the standard error (SE) for the percentage of red marbles drawn when the draws are made with…
Q: Average starting salaries for 2. students using a placement service at a university have been…
A: For the last 4 graduating classes (here each class represents a time period), the average salaries…
Q: A supermarket manager finds that 20% of his customers buy Brand X cornflakes. The other 80% buy…
A: (a)The probability that at least 4 customers buy Brand X is obtained below as follows:Let the random…
Q: Researchers conducted a study to determine whether magnets are effective in treating back pain. The…
A: Data for treatment:Sample mean, Sample standard deviation, Sample size, Data for sham:Sample mean,…
Q: Let JO, J1,..., J4 independent random variables according to the Ber (r₁) law, where i = 0, 1,...,…
A: In this problem, we are given five independent random variables, denoted as J0, J1, J2, J3, and J4.…
Q: What percentage of students from this school earn scores that satisfy the admission requirement?…
A: It is given thatMean, μ = 1490Standard deviation, σ = 296Z-Score, Z = ( X - μ )/σwhere, Z be the…
Q: The purpose of this assignment is to learn to compute key numerical measures for descriptive…
A:
Q: Use the expression in the accompanying discussion of sample size to find the size of each sample if…
A: The given confidence level is 95% and the margin of error is 0.045.
Q: b) What is the significance of the above statistics? (
A: The statistics calculated in the previous question areThe mean age at which patients suffered from…
Q: Consider the five number summary for salaries of U.S. marketing managers. Min Q1 Median Q3 Max 46460…
A: The five-number summary of the salaries are:Min…
Q: The table summarizes results from 988 pedestrian deaths that were caused by automobile accidents.…
A: The question is about probabilityGiven :Total no. of Pede. deaths = 988To find :Prob. that neither…
Q: Find the proportion of women who are between 61 and 67 inches tall. e proportion of women who are…
A: Suppose the random variable x defines the height of adult females.
Step by step
Solved in 5 steps with 4 images
- According to the 2016 Consumer Expenditure Survey, Americans spend an average of $1,124 on cellular phone service annually.† Suppose that we wish to determine if there are differences in cellular phone expenditures by age group. Therefore, samples of 10 consumers were selected for three age groups (18–34, 35–44, 45 and older). The annual expenditure for each person in the sample is provided in the table below. 18–34 35–44 45 and Older 1,355 969 1,135 115 434 956 1,456 1,792 400 2,045 1,500 1,374 1,621 1,277 1,244 994 1,056 825 1,937 1,922 763 1,200 1,350 1,192 1,567 1,586 1,305 1,390 1,415 1,510 (a) Compute the mean, variance, and standard deviation for each of the three samples. (Round your answers to two decimal places.) 18–34 35–44 45+ mean $ $ $ variance standard deviation $ $ $Suppose a certain retailer sells several models of refrigerators. A random sample of the models sold by this retailer and their corresponding cubic feet (cu. ft.) and list price can be found below. Model Cu. Ft. List Price Model 1 18.3 $899.99 Model 2 24.8 $1,799.99 Model 3with Thru-the-Door Ice and Water 25.4 $1,799.99 Model 4 19.3 $749.99 Model 5 17.3 $599.99 Model 6with Thru-the-Door Ice and Water 19.6 $1,619.99 Model 7 25.0 $999.99 Model 8 24.5 $1,299.99 Model 9with Thru-the-Door Ice and Water 25.4 $1,299.99 Model 10with Thru-the-Door Ice and Water 26.0 $1,299.99 Model 11with Thru-the-Door Ice and Water 25.6 $1,099.99 Model 12 18.0 $679.99 Model 13with Thru-the-Door Ice and Water 25.0 $2,199.99 Model 14 20.8 $849.99 Model 15 15.5 $549.99 Model 16with Thru-the-Door Ice and Water 28.2 $2,599.99 Model 17 27.8 $2,999.99 Model 18with Thru-the-Door Ice and Water 26.6 $2,399.99 Model 19with Thru-the-Door Ice and Water 22.6 $1,099.99 Model 20with…The Vice-President for Academic Affairs of SLU wished to understand the distribution of students in the academic programs in the institution for the first semester of school year 2020-2021. The numbers of students by school are the following: School Number of Students Teacher Education and Liberal Arts 2,069 Natural Sciences 2,565 Nursing 3,672 Engineering and Architecture 6,534 Accountancy, Management, Computing and Information Studies 8,381 Law 1,588 Medicine 1,418 Total Do these data contradict a claim that the distribution of students in the academic programs is uniform?
- 6.6 The Department of Natural Resources (DNR) received a complaint from recreational fish- ermen that a community was releasing sewage into the river where they fished. These types of releases lower the level of dissolved oxygen in the river and hence cause damage to the fish resid- ing in the river. An inspector from the DNR designs a study to investigate the fishermen’s claim. Fifteen water samples are selected at locations on the river upstream from the community and fifteen samples are selected downstream from the community. The dissolved oxygen readings in parts per million (ppm) are given in the following table. Upstream 5.2 4.8 5.1 5.0 4.9 4.8 5.0 4.7 4.7 5.0 4.6 5.2 5.0 4.9 4.7 Downstream 3.2 3.4 3.7 3.9 3.6 3.8 3.9 3.6 4.1 3.3 4.5 3.7 3.9 3.8 3.7 a. In order for the discharge to have an impact on fish health, there needs to be at least an .5 ppm reduction in the dissolved oxygen. Do the data provide sufficient evidence that there is a large enough reduction in the mean…Here are data for 15 subway systems in the United States and Puerto Rico Heavy Urban Rapid Rail Systems in the U.S. System Length (Miles) Index Number of Stations Index NYC Subway 245.0 472 Washington Metro 117.0 91 Chicago "L" 102.8 146 Massachusetts Bay Transportation Authority 38.0 53 Bay Area Rapid Transit 112.0 46 Southeastern PA Transity Authority 36.7 75 Path 13.8 13 MARTA Rail Transit 47.6 38 Metro Rail (Los Angeles) 17.4 16 Metro Rail (Los Angeles) 24.4 23 PATCO (Philadelphia, So. New Jersey) 14.2 133 Baltimore Metro Subway 15.5 14 Staten Island Railway 14.0 22 RTA Rapid Transit (Cleveland) 19.0 18 Tren Urbano (San Juan) 10.7 16 Average 55.2 78.4 Calculate index numbers for each subway system for: The length of the system in miles (Use the arithmetic mean as your base) The number of subway stations (Use the arithmetic mean as your base) c. Comment of your findingsAn urban economist wishes to test the claim that the distribution of United States residents in the United States is different today than it was in 1999. In 1999, 19.6 % of the population of the United States resided in the Northeast; 23.0 % of the population of the United States resided in the Midwest; 35.4 % of the population of the United States resided in the South; 22.0 % of the population of the United States resided in the West. The economist randomly selects 2000 households in the United States and obtains the frequency distribution below. Region Frequency Northeast 365 Midwest 404 South 752 West 479 Test the claim that the distribution of residents in the United States is different today from the distribution in 1999 at alpha = .05
- Based on sales over a six-month period, the five top-selling compact cars are Chevy Cruze, Ford Focus, Hyundai Elantra, Honda Civic, and Toyota Corolla.† Based on total sales, the market shares for these five compact cars were Chevy Cruze 24%, Ford Focus 21%, Hyundai Elantra 20%, Honda Civic 18%, and Toyota Corolla 17%. Suppose a sample of 400 compact car sales in one city showed the following number of vehicles sold. Chevy Cruze 108 Ford Focus 92 Hyundai Elantra 65 Honda Civic 83 Toyota Corolla 52 Use a goodness of fit test to determine if the sample data indicate that the market shares for the five compact cars in this city are different than the market shares reported by Motor Trend. Use a 0.05 level of significance. State the null and alternative hypotheses. H0: The market shares for the five automobiles in this city are 0.24, 0.21, 0.20, 0.18, 0.17.Ha: The market shares for the five automobiles in this city differ from the above shares.H0: The market shares…A study identified Bridgeport, Connecticut, San Jose, California, Washington, D.C., and Lexington Park, Maryland as the four U.S. cities with the highest percentage of millionaires. The following data show the following number of millionaires for samples of individuals from each of the four cities. Millionaire City Bridgeport, CT San Jose, CA Washington, D.C. Lexington Park, MD Yes 47 38 39 37 No 453 262 361 363 (1) What is the estimate of the percentage of millionaires in each of these cities? (Round your answers to two decimal places.) Bridgeport, CT ______ % San Jose, CA _______% Washington, D.C. _______% Lexington Park, __________MD % (2) Using a 0.05 level of significance, test for the equality of the population proportion of millionaires for these four cities. State the null and alternative hypotheses. A) H0: At least two of the population proportions are equal. Ha: None of the population proportions are equal. B) H0: Not all population proportions are equal.…#2. The following data show the educational level and productivity of 20 employees in the City of Fullerton Social Services Agency. Set up a contingency table on education and productivity and analyze your table to explain if there is a relationship between employee education and productivity. Education: SC = some college, BA = bachelor’s, MA = master’s Productivity = number of cases completed per week by the employee