3. A manufacturing firm wants to determine if there is a difference in the prices charged by two competing shipping companies. They sample shipping costs from both companies. Test at a 0.05 level of significance. Ho: Ha: Pooled variance S₁²= Mean SAMPLE Standard Deviation n crit = stat = Decision: Sample 1 $244.50 6 25 2 tails α = pvalue= Sample 2 $239.7 7 30
3. A manufacturing firm wants to determine if there is a difference in the prices charged by two competing shipping companies. They sample shipping costs from both companies. Test at a 0.05 level of significance. Ho: Ha: Pooled variance S₁²= Mean SAMPLE Standard Deviation n crit = stat = Decision: Sample 1 $244.50 6 25 2 tails α = pvalue= Sample 2 $239.7 7 30

MATLAB: An Introduction with Applications
6th Edition
ISBN:9781119256830
Author:Amos Gilat
Publisher:Amos Gilat
Chapter1: Starting With Matlab
Section: Chapter Questions
Problem 1P

Related questions
Question
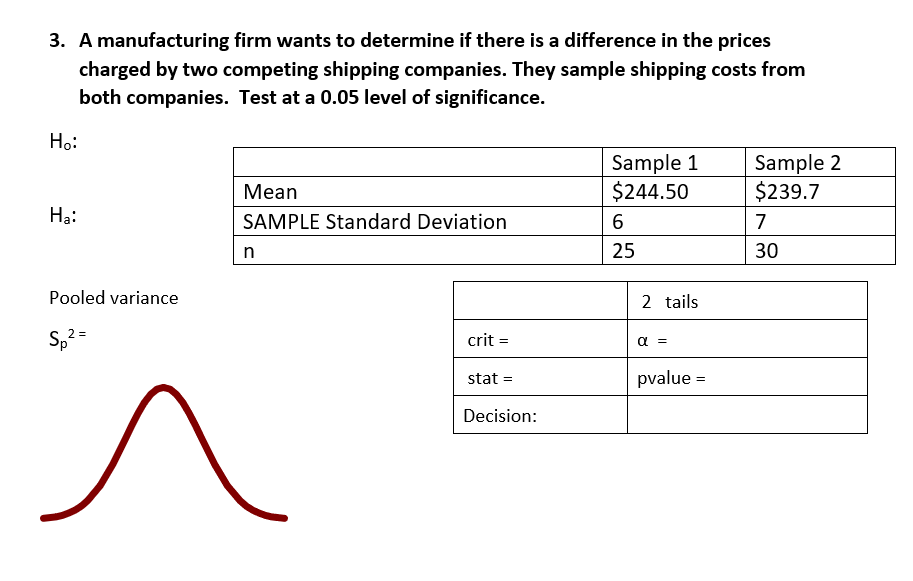
Transcribed Image Text:3. A manufacturing firm wants to determine if there is a difference in the prices
charged by two competing shipping companies. They sample shipping costs from
both companies. Test at a 0.05 level of significance.
Ho:
Ha:
Pooled variance
2
S₁²=
Mean
SAMPLE Standard Deviation
n
crit =
stat =
Decision:
Sample 1
$244.50
6
25
2 tails
α =
pvalue=
=
Sample 2
$239.7
7
30
Expert Solution
This question has been solved!
Explore an expertly crafted, step-by-step solution for a thorough understanding of key concepts.

This is a popular solution!

Trending now
This is a popular solution!

Step by step
Solved in 3 steps with 5 images

Recommended textbooks for you
MATLAB: An Introduction with Applications
Statistics
ISBN:
9781119256830
Author:
Amos Gilat
Publisher:
John Wiley & Sons Inc

Probability and Statistics for Engineering and th…
Statistics
ISBN:
9781305251809
Author:
Jay L. Devore
Publisher:
Cengage Learning

Statistics for The Behavioral Sciences (MindTap C…
Statistics
ISBN:
9781305504912
Author:
Frederick J Gravetter, Larry B. Wallnau
Publisher:
Cengage Learning
MATLAB: An Introduction with Applications
Statistics
ISBN:
9781119256830
Author:
Amos Gilat
Publisher:
John Wiley & Sons Inc
Probability and Statistics for Engineering and th…
Statistics
ISBN:
9781305251809
Author:
Jay L. Devore
Publisher:
Cengage Learning
Statistics for The Behavioral Sciences (MindTap C…
Statistics
ISBN:
9781305504912
Author:
Frederick J Gravetter, Larry B. Wallnau
Publisher:
Cengage Learning

Elementary Statistics: Picturing the World (7th E…
Statistics
ISBN:
9780134683416
Author:
Ron Larson, Betsy Farber
Publisher:
PEARSON

The Basic Practice of Statistics
Statistics
ISBN:
9781319042578
Author:
David S. Moore, William I. Notz, Michael A. Fligner
Publisher:
W. H. Freeman

Introduction to the Practice of Statistics
Statistics
ISBN:
9781319013387
Author:
David S. Moore, George P. McCabe, Bruce A. Craig
Publisher:
W. H. Freeman