If the sample correlation coefficient in Q1 above, were to be 0.85. Which choice provides the best conclusion of a hypothesis test: HO: p=0 vs HA: p70 using a=0.05. Reject HO since t stat > t critical value (5.398 > 2.306) None of these choices are correct. Reject HO since t stat > t critical value (3.952 > 2.447) Do Not Reject HO since t stat > t critical value (3.952 > 2.447)
If the sample correlation coefficient in Q1 above, were to be 0.85. Which choice provides the best conclusion of a hypothesis test: HO: p=0 vs HA: p70 using a=0.05. Reject HO since t stat > t critical value (5.398 > 2.306) None of these choices are correct. Reject HO since t stat > t critical value (3.952 > 2.447) Do Not Reject HO since t stat > t critical value (3.952 > 2.447)

Glencoe Algebra 1, Student Edition, 9780079039897, 0079039898, 2018
18th Edition
ISBN:9780079039897
Author:Carter
Publisher:Carter
Chapter10: Statistics
Section10.3: Measures Of Spread
Problem 1GP

Related questions
Question
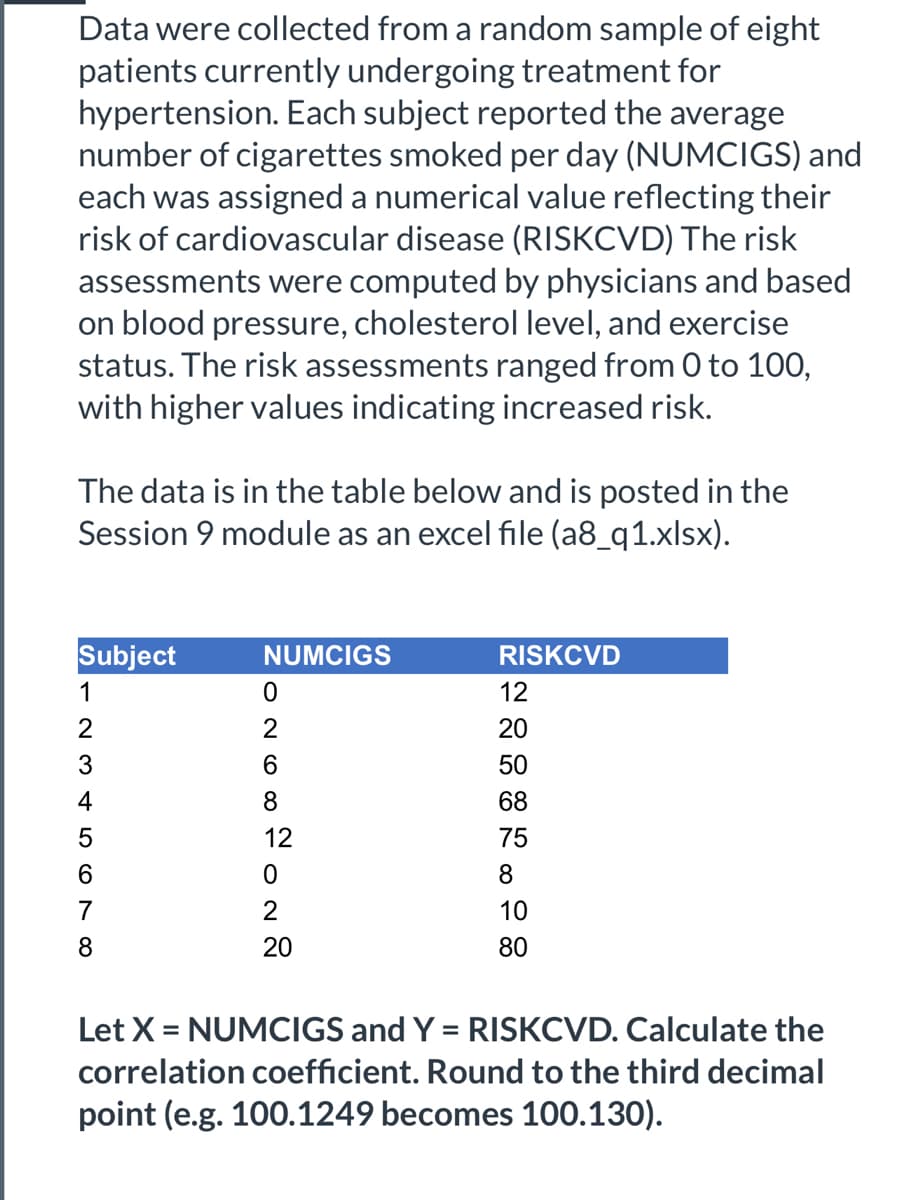
Transcribed Image Text:Data were collected from a random sample of eight
patients currently undergoing treatment for
hypertension. Each subject reported the average
number of cigarettes smoked per day (NUMCIGS) and
each was assigned a numerical value reflecting their
risk of cardiovascular disease (RISKCVD) The risk
assessments were computed by physicians and based
on blood pressure, cholesterol level, and exercise
status. The risk assessments ranged from 0 to 100,
with higher values indicating increased risk.
The data is in the table below and is posted in the
Session 9 module as an excel file (a8_q1.xlsx).
Subject
NUMCIGS
RISKCVD
1
12
2
2
20
3
50
4
8
68
12
75
6.
8.
7
2
10
20
80
Let X = NUMCIGS and Y = RISKCVD. Calculate the
correlation coefficient. Round to the third decimal
point (e.g. 100.1249 becomes 100.130).
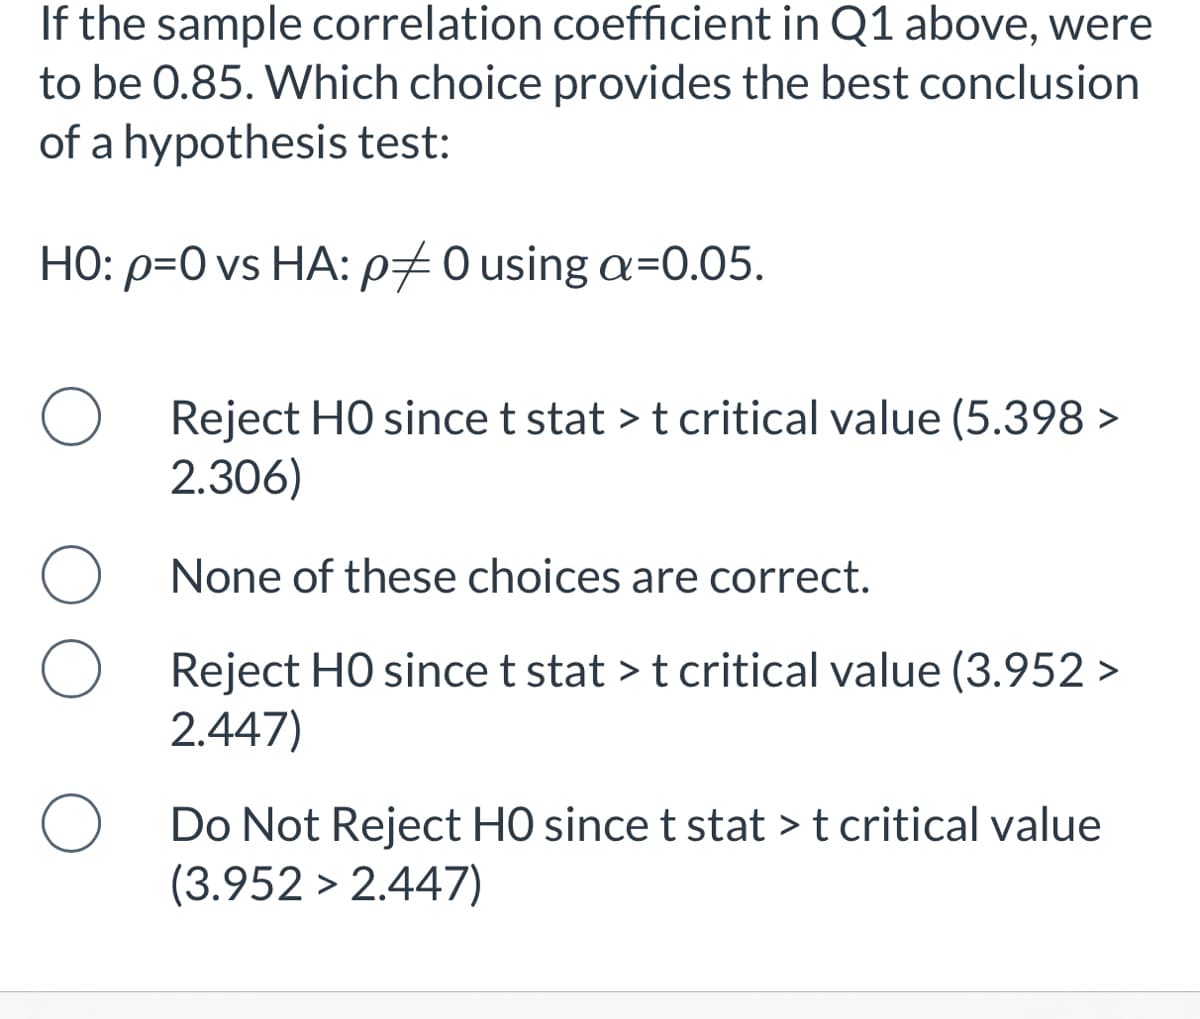
Transcribed Image Text:If the sample correlation coefficient in Q1 above, were
to be 0.85. Which choice provides the best conclusion
of a hypothesis test:
HO: p=0 vs HA: p70 using a=0.05.
Reject HO since t stat > t critical value (5.398 >
2.306)
None of these choices are correct.
Reject HO since t stat > t critical value (3.952 >
2.447)
Do Not Reject H0 since t stat > t critical value
(3.952 > 2.447)
Expert Solution
This question has been solved!
Explore an expertly crafted, step-by-step solution for a thorough understanding of key concepts.

Step by step
Solved in 2 steps

Recommended textbooks for you
Glencoe Algebra 1, Student Edition, 9780079039897…
Algebra
ISBN:
9780079039897
Author:
Carter
Publisher:
McGraw Hill
Glencoe Algebra 1, Student Edition, 9780079039897…
Algebra
ISBN:
9780079039897
Author:
Carter
Publisher:
McGraw Hill