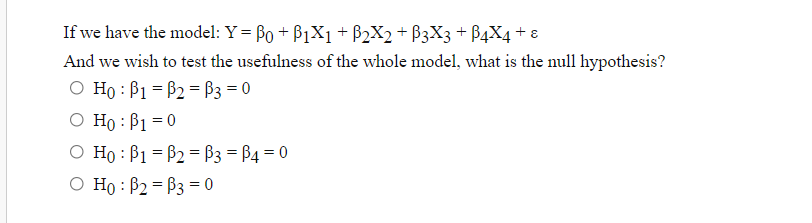
If we have the model: Y = Bo + B1X1 + B2X2 + B3X3 + B4X4 + e And we wish to test the usefulness of the whole model, what is the null hypothesis? O Ho : B1 = B2 = B3 = 0 O Ho : B1 = 0 O Ho : B1 = B2 = ß3 = B4 = 0 O Ho : B2 = B3 = 0


Q: b) What are the three models proposed as extensions of the GARCH model? Describe their advantages…
A: the 3 models proposed as extensions of the GARCH .Glosten, Jagannathan, and Runkle's .GJR-GARCH…
Q: For the horseshoe crab data with width, color, and spine as predictors, suppose you start a backward…
A: Ans: From a list of models , the best one is that with the minimum AIC , according to the given AIC…
Q: Which of the following are problems associated with the Engle-Granger approach to modelling using…
A: Given: The problems are associated with the Engle-Granger approach to modelling using cointegrated…
Q: Which of the following are feasible equations of a least squares regression line for the annual…
A: Rule 1: Population cant be negative; So please ignore - from the equations.
Q: 2. One leading company has developed what it hopes will be a home expresso machine that will have…
A: a) Parameter of interest: Here, the testing is based on the percentage of customers succeed at being…
Q: 5. Consider a multiple linear regression model of y on x, and x2, y = Bo + B1x1 + B2x2 +u, where u…
A:
Q: In the context of a controlled experiment, consider the simple linear regression formulation Yj = Bo…
A: Given : In the context of a controlled experiment, consider the simple linear regression formulation…
Q: Consider the following regression model: y= Bo+B,log(inc)+B2log(inc²). Which Gauss-markov assumption…
A: The regression analysis is a statistical procedure that allows us to find the linear association…
Q: Consider the following estimated regression model: Ý = 1.46 – 2.4 X + 0.75X2¡,i = 1, ... ,25, %3D…
A: Formula :
Q: Consider the following population regression model: Yi = Bo + B1D1i + B2Dzi + B3(D1¡D21) + uj,…
A: Given: the following population regression model: Y;= Bo + B1D1i +B2D2i+ B3(D1iP2i) + uj,, i = 1,…
Q: What is the most appropriate interpretation of the assumption covlu,u)-0 concerning the regression…
A: Covariance provides insight into how two variables are related to one another. More precisely,…
Q: 6) The line of best fit through a set of data isy=36.704+0.985xy=36.704+0.985x According to…
A: From the above data we are given that The equation of the regeneration line y=36.704+0.985x
Q: 3. When fitting a straight line y = ag + a,x to the three data points (x,.y) = (0,0),(1,0) and…
A:
Q: Consider the following econometric model birthweight = Bo+B₁smoking+u where birthweight is a baby's…
A: Consider the following econometric model birthweight = β0 + β1 smoking + u where birthweight is…
Q: 7. Apply the Gauss-Seidel method to Exercise 3.
A: Consider the system of linear equations, 2x1-x2=2x1-3x2+x3=-2-x1+x2-3x3=-6 The objective is to solve…
Q: You have a multiple regression that contains one dependent variable Y and four independent variables…
A: Multiple regression: A multiple regression analysis is used when two or more independent variables…
Q: By using the method of least squares, find the best line through the points: (−2,−1), (0,−2),…
A:
Q: 1. Derive the least squares estimator of Bo for the regression model Y; = Bo + Ei.
A: Given that, 1. Regression model:- Yi = βo + εi We need to derive the least squares estimator of…
Q: If µ1 =population mean number of effective hours for standard wax and u2 = population mean number of…
A: Denote μ1 as the population mean number of effective hours for standard wax (population 1) and μ2 as…
Q: Let X1 equal a constant (column of ones) plus three predictors. Let X2 contain three more…
A: From the given information, It has been provided to us that, X1=C+xi, i=1,2,3,…
Q: GIve Proof of the Gauss–Markov Theorem for Multiple Regression?
A:
Q: Consider the simple linear regression Y: = Bo + B1a, +E, (a) Derive the weighted least squares…
A: The given equation, in linear regression model with non constant error variance can be fitted by…
Q: 4. Find the parameters and equation of the least squares regression line using the points (1,0),…
A: Given that x1,y1, x2,y2, . . . ,xn,ynare the n data points on the xy- plane. Then to find the best…
Q: How will you choose between following non-nested competing models:- Md=Beta lag (0)+ beta lag(1) Y+…
A: Non-nested models refer to the models that have no associated with one another and are not obtained…
Q: The following scatterplot shows two variables along with a least-squares regression line. y 26- 24-…
A: Identify the correct option for the outlier that represented in the Scatterplot. The correct…
Q: - Find the regression model. Regresyon modelini bulunuz. Y X
A: We have used the excel data analysis tool to run the regression analysis.
Q: Which of the following are feasible equations of a least squares regression line for the annual…
A: Regression equation is generally of the form Pt = P0 + kx where P0 is the intercept on y and k is…
Q: Consider the linear model y = Bo + B1r + u. Which criterion is used to find the OLS estimators for…
A: Solution: From the given information, the linear model is
Q: In the context of a controlled experiment, consider the simple linear regression formulation Yj = Bo…
A: Solution Given : In the context of a controlled experiment, consider the simple linear regression…
Q: Which of the following are feasible equations of a least squares regression line for the annual…
A: Introduction: The population of a country can either be a positive quantity, or 0. In other words,…
Q: Consider the one-variable regression model Yi = β0 + β1Xi + ui and suppose that it satisfies the…
A:
Q: . The number of murders and robberies per 100,000 population for a random selection of states are…
A:
Q: (1) Give the equation of the fitted regression model. bị: (Round off to 4 decimal places) bo: (Round…
A: As per guidelines we will solve the first question only, please repost other questions for more…
Q: Myla conducted a survey to all grade 6 students and claimed that their average age is 12. 5. What is…
A: 5. The parameter of Interest is a) Average age is 12. because this is the parameter we are…
Q: Consider the first order linear PDE и, (х, у) + 2и,(х, у) + u(х, у) %3 4х. Find its general solution
A:
Q: IF the regression Yi=b1+b2X2i+b3X3i+b4X4i+ei, has three auxiliary regression with the following R…
A:
Q: Derive the least squares estimators (LSEs) of the parameters in the simple linear regression model.
A: Please find the explanation below. Thank you.
Q: Find the least-squares regression line ŷ = bo + b1x through the points %3D (-2, 0), (3, 7), (5, 14),…
A: The least-square regression technique uses a dataset to determine a linear function: y^=b0+b1x such…
Q: 1. The date below are to be used to predict y from x. 1 4 Xi 4 3 3 4 yi 16 12 17 13 22 Assume that…
A:
Q: ) Suppose you run the regression: y = Bo + B1x1 + B2x2 + u, where the error term u satisfies the…
A: Ordinary Least Square Assumptions are given as a true regression model and the data generating…
Q: Using 25 observations on each variable, a computer program generated the following multiple…
A: Here it is required to test if the independent variable x1 is needed in the regression model. To…
Q: Given the points (1, 1), (2, 3), (−3, 1), find the least squares regression line means of matrix…
A: Let the equation of the east square regression line be y=mx+c (i) Since the line (i)…
Q: Xi 1 2 Yi 2 4 7 8 Using the table data above, obtain the linear regression equation using the least…
A: Step 1: For each (x,y) calculate x2 and xy: Step 2: Sum x, y, x2 and xy (gives us Σx, Σy, Σx2 and…
Q: Consider the following population model for household consumption: cons = a + b1 * inc+ b2 * educ+…
A:
Q: When fitting a straight line y = ao + a¸x _to the three data points (xị, yi) = (0,0) , (1,0) and…
A:
Q: Suppose we want to predict job performance of mechanics based on mechanical aptitude test scores and…
A: Given, Y X1 X2 1 40 25 2 45 20 1 38 30 3 50 30 2 48 28 3 55 30 3 53 34 4 55 36…
Q: In a study to predict temperature from air pressure in a piston-cylinder device, 19 measurements…
A:
Q: a. Mathematically express the CLRM assumption that is potentially violated if we omit a relevant…
A:
Q: Given the least squares regression line ˆy = 5.2 – 1.2x, and a coefficient of determination of…
A: The regression equation and coefficient of determination are given. From the given estimates, this…


Trending now
This is a popular solution!

Step by step
Solved in 2 steps


- Explain the differences between Gaussian elimination and Gauss-Jordan elimination.What is the significance of R and R2 in gression model?In terms of the model parameters, state the null hypothesis that, after controlling for sales and roe, ros has no effect on CEO salary. State the alternative that better stock market performance increases a CEO’s salary.
- If the data is highly skewed, can we still rely on the kurtosis coefficient? Why or why not?What would be my research hypothesis for this scenario?In the context of a controlled experiment, consider the simple linear regression formulation Yi = β0 + β1Xi + Ui. Let the Yi be the outcome, Xi the treatment level when the treatment is binary, and Ui contain all the additional determinants of the outcome. Then: a. the OLS estimator of the slope will be inconsistent in the case of a randomly assigned Xi since there are omitted variables present. b. Xi and Ui will not be independently distributed if the Xi are randomly assigned. c. β0 represents the causal effect of X on Y when X is zero. d. E(Y|X= 1) is the expected value for the treatment group. e. All of the above. f. None of the above.
- In a multiple linear regression model with 3 predictor variables, what is the t-statistic for the hypothesis test of the null hypothesis that the coefficient of the second predictor variable is equal to 0, if the estimated coefficient is 0.5, the standard error of the estimate is 0.1, and the degrees of freedom is 15?b) What are the three models proposed as extensions of the GARCH model? Describe their advantages over the GARCH.8)Suppose that Y is normal and we have three explanatory unknowns which are also normal, and we have an independent random sample of 11 members of the population, where for each member, the value of Y as well as the values of the three explanatory unknowns were observed. The data is entered into a computer using linear regression software and the output summary tells us that R-square is 0.86, the linear model coefficient of the first explanatory unknown is 7 with standard error estimate 2.5, the coefficient for the second explanatory unknown is 11 with standard error 2, and the coefficient for the third explanatory unknown is 15 with standard error 4. The regression intercept is reported as 28. The sum of squares in regression (SSR) is reported as 86000 and the sum of squared errors (SSE) is 14000. From this information, what is MSE/MST? .5000 NONE OF THE OTHERS .2000 .3000 .4000
- The y-interept bo of a least-squares regression line has a useful interpretation only if the x-values are either all positive or all negative. Determine if the statement is true or false. Why? If the statement is false, rewrite as a true statement.9)Suppose that Y is normal and we have three explanatory unknowns which are also normal, and we have an independent random sample of 11 members of the population, where for each member, the value of Y as well as the values of the three explanatory unknowns were observed. The data is entered into a computer using linear regression software and the output summary tells us that R-square is 0.79, the linear model coefficient of the first explanatory unknown is 7 with standard error estimate 2.5, the coefficient for the second explanatory unknown is 11 with standard error 2, and the coefficient for the third explanatory unknown is 15 with standard error 4. The regression intercept is reported as 28. The sum of squares in regression (SSR) is reported as 79000 and the sum of squared errors (SSE) is 21000. From this information, what is the adjusted R-square? .8 .7 NONE OF THE OTHERS .6 .5A set of paired data has a least squares regressionline with equation yn = 0.50x + 2.0 and a correlationcoefficient of r = 0.80. Suppose we convert the datafor each variable to z-scores and then compute the newregression line. What will the equation be?A) zˆy = 0.50zx B) zˆy = 0.64zxC) zˆy = 0.80zx D) zˆy = 0.50zx + 20E) zˆy = 0.80zx + 20