(ii) Suppose Country B is similar to Country A in the amount of government expenditures and the level of real GDP at full employment. But instead of a proportional tax system, Country B has a lump-sum (regressive) tax system that balances the budget at all levels of GDP. Graph the tax revenues for this country. Instructions: Use the tool provided 'Tax revenues' to illustrate the country's tax revenues. Plot the first point of the line where real GDP is $20 billion and the second point where real GDP is $80 billion. Plot only the endpoints of the line. $25 Tools $20 Tax revenues $15 and tax revenues, T (billions)
(ii) Suppose Country B is similar to Country A in the amount of government expenditures and the level of real GDP at full employment. But instead of a proportional tax system, Country B has a lump-sum (regressive) tax system that balances the budget at all levels of GDP. Graph the tax revenues for this country. Instructions: Use the tool provided 'Tax revenues' to illustrate the country's tax revenues. Plot the first point of the line where real GDP is $20 billion and the second point where real GDP is $80 billion. Plot only the endpoints of the line. $25 Tools $20 Tax revenues $15 and tax revenues, T (billions)

Chapter1: Making Economics Decisions
Section: Chapter Questions
Problem 1QTC

Related questions
Question
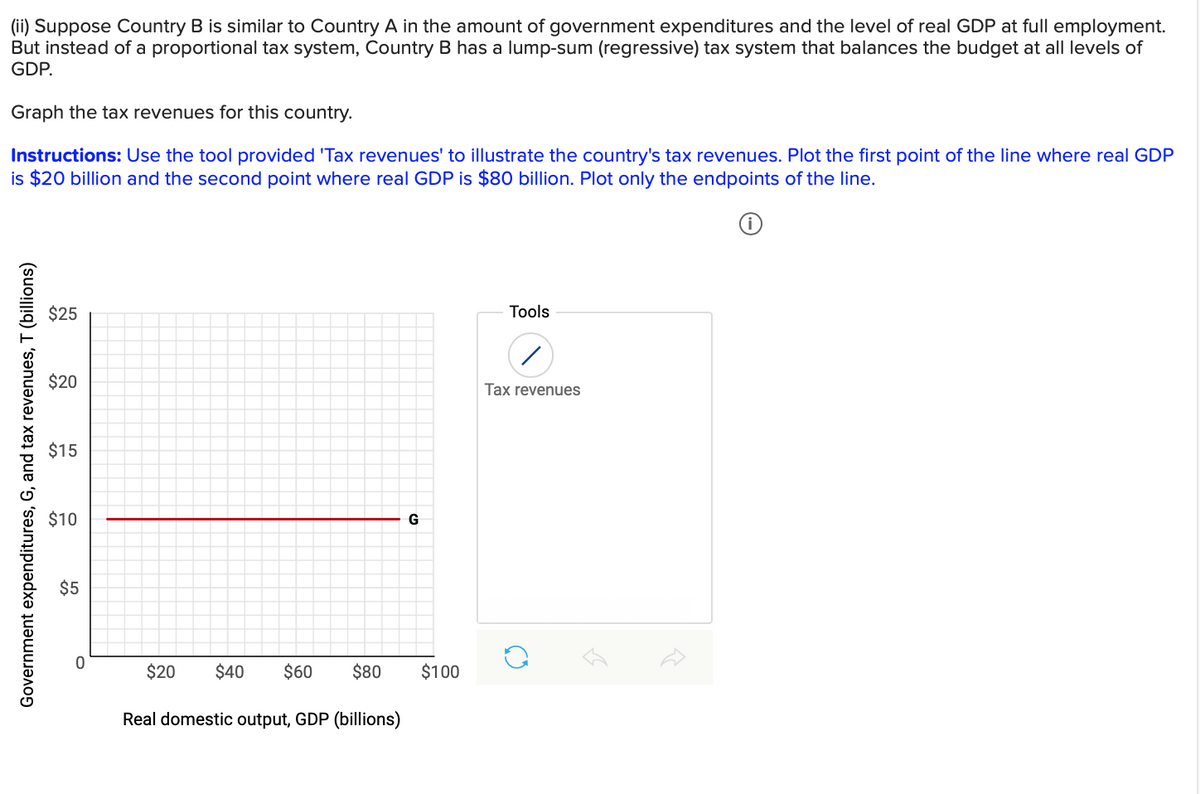
Transcribed Image Text:(ii) Suppose Country B is similar to Country A in the amount of government expenditures and the level of real GDP at full employment.
But instead of a proportional tax system, Country B has a lump-sum (regressive) tax system that balances the budget at all levels of
GDP.
Graph the tax revenues for this country.
Instructions: Use the tool provided 'Tax revenues' to illustrate the country's tax revenues. Plot the first point of the line where real GDP
is $20 billion and the second point where real GDP is $80 billion. Plot only the endpoints of the line.
$25
Tools
$20
Tax revenues
$15
$10
G
$5
$20
$40
$60
$80
$100
Real domestic output, GDP (billions)
Government expenditures, G, and tax revenues, T (billions)
Expert Solution
This question has been solved!
Explore an expertly crafted, step-by-step solution for a thorough understanding of key concepts.

This is a popular solution!

Trending now
This is a popular solution!

Step by step
Solved in 2 steps with 1 images

Recommended textbooks for you

Principles of Economics (12th Edition)
Economics
ISBN:
9780134078779
Author:
Karl E. Case, Ray C. Fair, Sharon E. Oster
Publisher:
PEARSON

Engineering Economy (17th Edition)
Economics
ISBN:
9780134870069
Author:
William G. Sullivan, Elin M. Wicks, C. Patrick Koelling
Publisher:
PEARSON
Principles of Economics (12th Edition)
Economics
ISBN:
9780134078779
Author:
Karl E. Case, Ray C. Fair, Sharon E. Oster
Publisher:
PEARSON
Engineering Economy (17th Edition)
Economics
ISBN:
9780134870069
Author:
William G. Sullivan, Elin M. Wicks, C. Patrick Koelling
Publisher:
PEARSON

Principles of Economics (MindTap Course List)
Economics
ISBN:
9781305585126
Author:
N. Gregory Mankiw
Publisher:
Cengage Learning

Managerial Economics: A Problem Solving Approach
Economics
ISBN:
9781337106665
Author:
Luke M. Froeb, Brian T. McCann, Michael R. Ward, Mike Shor
Publisher:
Cengage Learning

Managerial Economics & Business Strategy (Mcgraw-…
Economics
ISBN:
9781259290619
Author:
Michael Baye, Jeff Prince
Publisher:
McGraw-Hill Education