II. An original population of finches on Daphne Island is polymorphic when it comes to beak sizes. (this population feeds on seeds of varying sizes from different species of plants). At first the beak size variations and their main food source were as follows: Small beak/small seeds 25% Medium beak/medium seeds 50% Large beak / large 25%
II. An original population of finches on Daphne Island is polymorphic when it comes to beak sizes. (this population feeds on seeds of varying sizes from different species of plants). At first the beak size variations and their main food source were as follows: Small beak/small seeds 25% Medium beak/medium seeds 50% Large beak / large 25%

Biology: The Dynamic Science (MindTap Course List)
4th Edition
ISBN:9781305389892
Author:Peter J. Russell, Paul E. Hertz, Beverly McMillan
Publisher:Peter J. Russell, Paul E. Hertz, Beverly McMillan
Chapter52: Population Ecology
Section: Chapter Questions
Problem 6TYK: One reason why human populations have been able to sidestep the factors that usually control...

Related questions
Question
Hi I need the answer to this question please Thank you
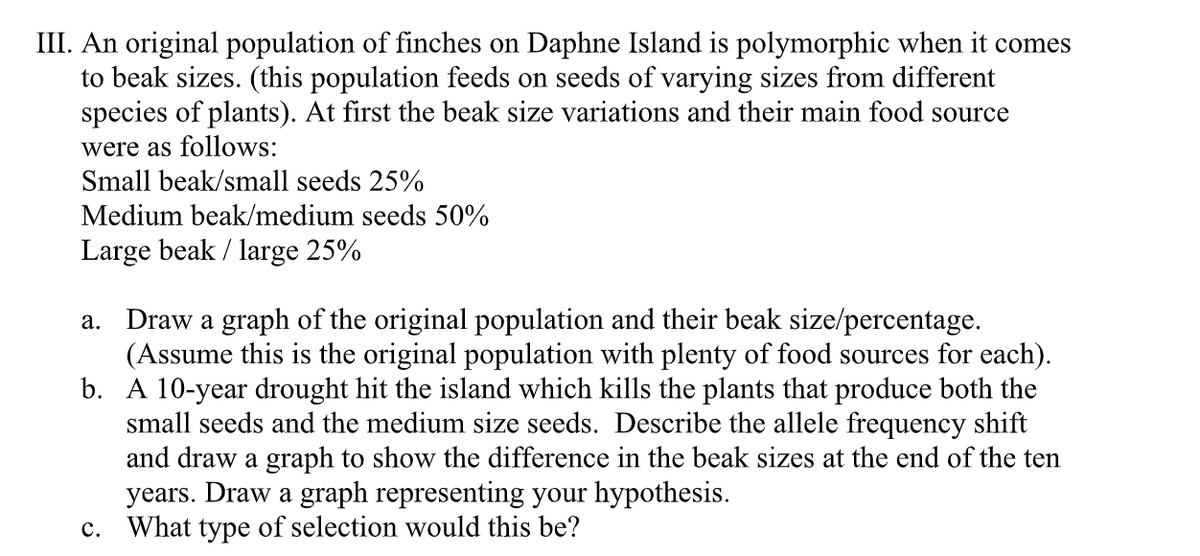
Transcribed Image Text:III. An original population of finches on Daphne Island is polymorphic when it comes
to beak sizes. (this population feeds on seeds of varying sizes from different
species of plants). At first the beak size variations and their main food source
were as follows:
Small beak/small seeds 25%
Medium beak/medium seeds 50%
Large beak / large 25%
a. Draw a graph of the original population and their beak size/percentage.
(Assume this is the original population with plenty of food sources for each).
b. A 10-year drought hit the island which kills the plants that produce both the
small seeds and the medium size seeds. Describe the allele frequency shift
and draw a graph to show the difference in the beak sizes at the end of the ten
years. Draw a graph representing your hypothesis.
c. What type of selection would this be?
Expert Solution
This question has been solved!
Explore an expertly crafted, step-by-step solution for a thorough understanding of key concepts.

Step by step
Solved in 2 steps with 2 images

Knowledge Booster


Learn more about
Need a deep-dive on the concept behind this application? Look no further. Learn more about this topic, biology and related others by exploring similar questions and additional content below.Recommended textbooks for you
Biology: The Dynamic Science (MindTap Course List)
Biology
ISBN:
9781305389892
Author:
Peter J. Russell, Paul E. Hertz, Beverly McMillan
Publisher:
Cengage Learning

Biology: The Unity and Diversity of Life (MindTap…
Biology
ISBN:
9781305073951
Author:
Cecie Starr, Ralph Taggart, Christine Evers, Lisa Starr
Publisher:
Cengage Learning

Biology: The Unity and Diversity of Life (MindTap…
Biology
ISBN:
9781337408332
Author:
Cecie Starr, Ralph Taggart, Christine Evers, Lisa Starr
Publisher:
Cengage Learning
Biology: The Dynamic Science (MindTap Course List)
Biology
ISBN:
9781305389892
Author:
Peter J. Russell, Paul E. Hertz, Beverly McMillan
Publisher:
Cengage Learning
Biology: The Unity and Diversity of Life (MindTap…
Biology
ISBN:
9781305073951
Author:
Cecie Starr, Ralph Taggart, Christine Evers, Lisa Starr
Publisher:
Cengage Learning
Biology: The Unity and Diversity of Life (MindTap…
Biology
ISBN:
9781337408332
Author:
Cecie Starr, Ralph Taggart, Christine Evers, Lisa Starr
Publisher:
Cengage Learning