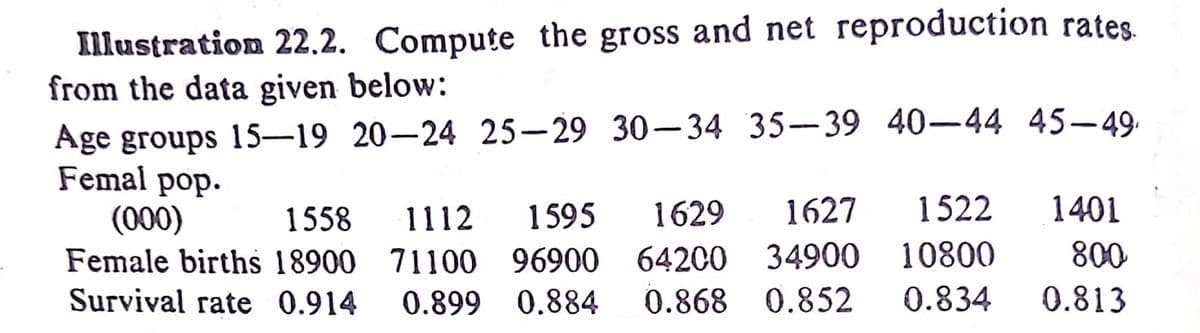
Illustration 22.2. Compute the gross and net reproduction rates. from the data given below: Age groups 15-19 20-24 25-29 30-34 35-39 40-44 45-49- Femal pop. (000) Female births 18900 71100 96900 64200 34900 Survival rate 0.914 1558 1112 1595 1629 1627 1522 1401 10800 800 0.899 0.884 0.868 0.852 0.834 0.813
Illustration 22.2. Compute the gross and net reproduction rates. from the data given below: Age groups 15-19 20-24 25-29 30-34 35-39 40-44 45-49- Femal pop. (000) Female births 18900 71100 96900 64200 34900 Survival rate 0.914 1558 1112 1595 1629 1627 1522 1401 10800 800 0.899 0.884 0.868 0.852 0.834 0.813

Chapter3: Functions
Section3.3: Rates Of Change And Behavior Of Graphs
Problem 26SE: Table 3 gives the annual sales (in millions of dollars) of a product from 1998 to 20006. What was...

Related questions
Question
Transcribed Image Text:Illustration 22.2. Compute the gross and net reproduction rates
from the data given below:
Age groups 15-19 20-24 25–29 30–34 35–39 40-44 45-49,
Femal pop.
(000)
Female births 18900 71100 96900
1558
1112
1595
1629
1627
1522
1401
64200
34900 10800
800
Survival rate 0.914
0.899 0.884
0.868 0.852
0.834
0.813
Expert Solution
This question has been solved!
Explore an expertly crafted, step-by-step solution for a thorough understanding of key concepts.

This is a popular solution!

Trending now
This is a popular solution!

Step by step
Solved in 3 steps with 3 images

Recommended textbooks for you


Trigonometry (MindTap Course List)
Trigonometry
ISBN:
9781337278461
Author:
Ron Larson
Publisher:
Cengage Learning
Trigonometry (MindTap Course List)
Trigonometry
ISBN:
9781337278461
Author:
Ron Larson
Publisher:
Cengage Learning

Mathematics For Machine Technology
Advanced Math
ISBN:
9781337798310
Author:
Peterson, John.
Publisher:
Cengage Learning,

Algebra for College Students
Algebra
ISBN:
9781285195780
Author:
Jerome E. Kaufmann, Karen L. Schwitters
Publisher:
Cengage Learning

Algebra & Trigonometry with Analytic Geometry
Algebra
ISBN:
9781133382119
Author:
Swokowski
Publisher:
Cengage