I'm not sure whether to solve with a T test or a Z test because n < 30 (T test), but the standard deviation is known (Z test). How can I figure out which test statistic to use when both test statistics have a condition (ie n < 30 and std dev is known) that is true? Thank you.
I'm not sure whether to solve with a T test or a Z test because n < 30 (T test), but the standard deviation is known (Z test). How can I figure out which test statistic to use when both test statistics have a condition (ie n < 30 and std dev is known) that is true? Thank you.

MATLAB: An Introduction with Applications
6th Edition
ISBN:9781119256830
Author:Amos Gilat
Publisher:Amos Gilat
Chapter1: Starting With Matlab
Section: Chapter Questions
Problem 1P

Related questions
Question
I'm not sure whether to solve with a T test or a Z test because n < 30 (T test), but the standard deviation is known (Z test). How can I figure out which test statistic to use when both test statistics have a condition (ie n < 30 and std dev is known) that is true? Thank you.
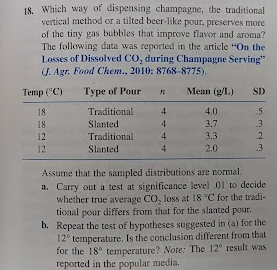
Transcribed Image Text:18. Which way of dispensing champagne, the traditional
vertical method or a tilted beer-like pour, preserves more
of the tiny gas bubbles that improve flavor and aroma?
The following data was reported in the article "On the
Losses of Dissolved CO, during Champagne Serving"
(J. Agr. Food Chem., 2010: 8768 8775).
Temp ("C)
Type of Pour
Mean (g/L)
SD
18
Traditional
4
4.0
18
Slanted
4
3.7
12
Traditional
4.
3.3
12
Slanted
4
2.0
.3
Assume that the sampled distributions are normal.
1. Carry out a test at significance level .01 to decide
whether true average CO, loss at 18 °C for the tradi-
tional pour differs from that for the slanted pour.
b. Repeat the test of hypotheses suggested in (a) for the
12° temperature. Is the conclusion different from that
for the 18° temperature? Note: The 12° result was
reported in the popular media.
wiwwin
Expert Solution
This question has been solved!
Explore an expertly crafted, step-by-step solution for a thorough understanding of key concepts.

Step by step
Solved in 3 steps

Recommended textbooks for you
MATLAB: An Introduction with Applications
Statistics
ISBN:
9781119256830
Author:
Amos Gilat
Publisher:
John Wiley & Sons Inc

Probability and Statistics for Engineering and th…
Statistics
ISBN:
9781305251809
Author:
Jay L. Devore
Publisher:
Cengage Learning

Statistics for The Behavioral Sciences (MindTap C…
Statistics
ISBN:
9781305504912
Author:
Frederick J Gravetter, Larry B. Wallnau
Publisher:
Cengage Learning
MATLAB: An Introduction with Applications
Statistics
ISBN:
9781119256830
Author:
Amos Gilat
Publisher:
John Wiley & Sons Inc
Probability and Statistics for Engineering and th…
Statistics
ISBN:
9781305251809
Author:
Jay L. Devore
Publisher:
Cengage Learning
Statistics for The Behavioral Sciences (MindTap C…
Statistics
ISBN:
9781305504912
Author:
Frederick J Gravetter, Larry B. Wallnau
Publisher:
Cengage Learning

Elementary Statistics: Picturing the World (7th E…
Statistics
ISBN:
9780134683416
Author:
Ron Larson, Betsy Farber
Publisher:
PEARSON

The Basic Practice of Statistics
Statistics
ISBN:
9781319042578
Author:
David S. Moore, William I. Notz, Michael A. Fligner
Publisher:
W. H. Freeman

Introduction to the Practice of Statistics
Statistics
ISBN:
9781319013387
Author:
David S. Moore, George P. McCabe, Bruce A. Craig
Publisher:
W. H. Freeman