Imajor tax cuts 1800 tincreases 500 1600 -avg pretax income of Top 1% avg pretax income of 1400 Top 5% 400 --avg pretax income of Top 10% 1200 -avg. pretax income of Highest Quintile ag pretax income of 1000 All Quintiles 300 Avg federal taes paid by Top 1% 800 *Avg federal taxes paid by Top 5% 600 -Avg. federal taxes paid by Top 10% Avg. federal taxes paid by Highest Quintile 400 100 Avg federal taxes paid by All Quintiles 200 190 1 192 19 1 7 200 2001 2002 20 2004 200s 2006 20 2000 1964 15 19 1 2000 2000 2000 2000 2000 osson years mert 2000 2000 2000 2000 2000 2000 2000 2000 2000 2000 g pta nconef Tae 1% s pa ncomeof Tap s tacomeof Tap 10 s peta income oighet Que s pta incomeAQes Ag der padby Tap Aug teders padby Tap Ag der pady Top 10% Aug der pedby Hghest Qune 6 370 22332 5500 S18S S14S S S8 6473 S S04 7314 s211 572 8226 7415 40S 79 330 98126 16 |348 2369 227 238O 2506 2747 259 443 3052 sE 2 45 047 3303 s 343 7 44 12 167 145 11 144 17 204 23 200 1e 2 2305 201 2330 2314 2376 2 270 275 30s 4 S4 1 27 269 7e 20 3745 1403 1367 147 1347 192 2124 2s 1 1as 2 2 14 a 2 247 27 25 213 23 2101 34 613 e11 0s 613 640 e56 4 0 ne 16 08 ee 08 11 20 47 12 03 42 a 2 42 06 a 2034 1793 5 32 2 7 27 222 2734 2475 26 2214 272 275 E 17 45 792 729 S1 S13 2 445 457 S04 S11 S7S 99 645 27 603 S4 26 662 745 3 859 4 S75 101 3 91 795 E 999 1042 1052 18730 423 43 49 es33 20 4 716 726 M 70 2 S19 72 2 7 10 4 1231 1340 e3 1534 1332 1202 122 39462 67 410 4194 9 e4 413 5 456 171 S29 $24 75 avg. pre-tax income in thousands ofS avg. tax payments in thousands of $
Imajor tax cuts 1800 tincreases 500 1600 -avg pretax income of Top 1% avg pretax income of 1400 Top 5% 400 --avg pretax income of Top 10% 1200 -avg. pretax income of Highest Quintile ag pretax income of 1000 All Quintiles 300 Avg federal taes paid by Top 1% 800 *Avg federal taxes paid by Top 5% 600 -Avg. federal taxes paid by Top 10% Avg. federal taxes paid by Highest Quintile 400 100 Avg federal taxes paid by All Quintiles 200 190 1 192 19 1 7 200 2001 2002 20 2004 200s 2006 20 2000 1964 15 19 1 2000 2000 2000 2000 2000 osson years mert 2000 2000 2000 2000 2000 2000 2000 2000 2000 2000 g pta nconef Tae 1% s pa ncomeof Tap s tacomeof Tap 10 s peta income oighet Que s pta incomeAQes Ag der padby Tap Aug teders padby Tap Ag der pady Top 10% Aug der pedby Hghest Qune 6 370 22332 5500 S18S S14S S S8 6473 S S04 7314 s211 572 8226 7415 40S 79 330 98126 16 |348 2369 227 238O 2506 2747 259 443 3052 sE 2 45 047 3303 s 343 7 44 12 167 145 11 144 17 204 23 200 1e 2 2305 201 2330 2314 2376 2 270 275 30s 4 S4 1 27 269 7e 20 3745 1403 1367 147 1347 192 2124 2s 1 1as 2 2 14 a 2 247 27 25 213 23 2101 34 613 e11 0s 613 640 e56 4 0 ne 16 08 ee 08 11 20 47 12 03 42 a 2 42 06 a 2034 1793 5 32 2 7 27 222 2734 2475 26 2214 272 275 E 17 45 792 729 S1 S13 2 445 457 S04 S11 S7S 99 645 27 603 S4 26 662 745 3 859 4 S75 101 3 91 795 E 999 1042 1052 18730 423 43 49 es33 20 4 716 726 M 70 2 S19 72 2 7 10 4 1231 1340 e3 1534 1332 1202 122 39462 67 410 4194 9 e4 413 5 456 171 S29 $24 75 avg. pre-tax income in thousands ofS avg. tax payments in thousands of $

Chapter11: Managing Aggregate Demand: Fiscal Policy
Section: Chapter Questions
Problem 1DQ

Related questions
Question
QUESTION 1
-
01. Referring to Fig 2d and the attached table, determine whether average pre-tax income of the top 10%, top 5%, top 1% of households by income has increased or decreased in the recession years of 1980-81, 1990-91, and 2001 (as compared to immediately prior year).Increaseddecreased
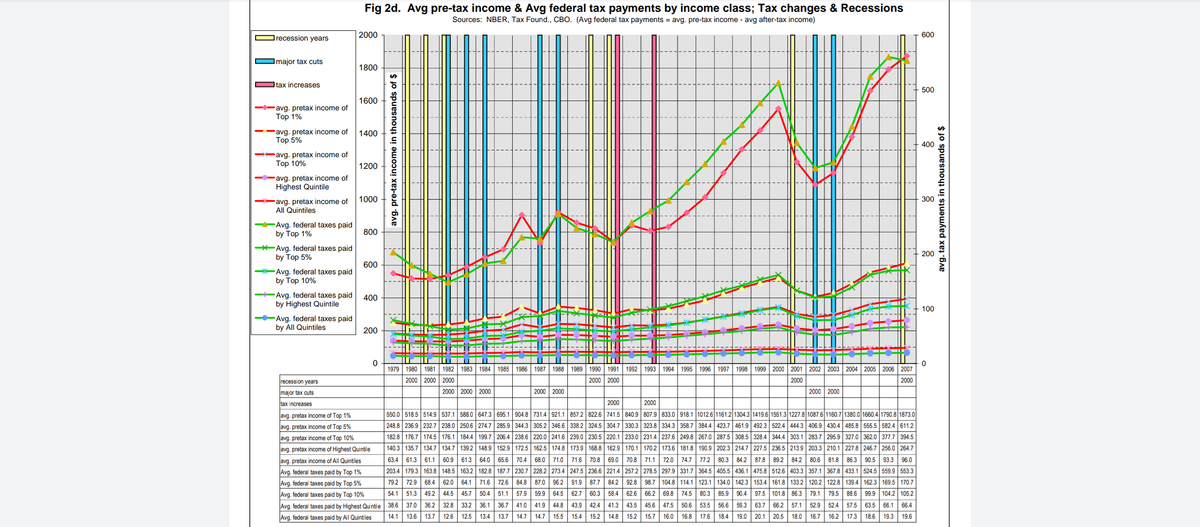
Transcribed Image Text:Fig 2d. Avg pre-tax income & Avg federal tax payments by income class; Tax changes & Recessions
Sources: NBER, Tax Found., CBO. (Avg federal tax payments = avg. pre-tax income - avg after-tax income)
recession years
2000
600
Imajor tax cuts
1800
Itax increases
500
1600
-avg. pretax income of
Top 1%
--avg. pretax income of
Top 5%
1400
400
-avg. pretax income of
Top 10%
1200
-avg. pretax income of
Highest Quintile
1000
300
-avg. pretax income of
All Quintiles
-Avg. federal taxes paid
by Top 1%
800
Avg. federal taxes paid
by Top 5%
200
600
Avg. federal taxes paid
by Top 10%
Avg. federal taxes paid
by Highest Quintile
400
100
-Avg. federal taxes paid
by All Quintiles
200
1979
1980
1981
1982
1983
1984
1985
1986 1987
1988
1989 1990 1991
1992
1993
1994 1995
1996 1997
1998 1999 2000 2001 2002 2003 2004 2005 2006 2007
recession years
2000 2000 | 2000
2000 2000
2000
2000
major tax cuts
2000 2000 2000
2000 2000
2000 2000
tax increases
2000
2000
avg. pretax income of Top 1%
550.0 518.5 514.9 537.1 588.0 647.3 695.1 904.8 731.4 921.1 857.2 822.6 741.5 840.9 807.9 833.0 918.1 1012.6 1161.2 1304.3 1419.6 1551.3 1227.8 1087.6|1160.7| 1380.0|1660.4 1790.8 1873.0
avg. pretax income
5%
248.8 236.9 232.7 238.0 250.6 274.7 285.9 344.3 305.2 346.6 338.2 324.5 304.7 330.3 323.8 334.3 358.7 384.4 423.7 461.9 492.3 522.4 444.3 406.9 430.4 485.8 555.5 582.4 611.2
182.8 176.7 174.5 176.1 184.4 199.7 206.4 238.6 220.0 241.6 239.0 230.5 220.1 233.0 231.4 237.6 249.8 267.0 287.5 308.5 328.4 344.4 303.1 283.7 295.9 327.0 362.0 377.7 394.5
avg. pretax income of Top 10%
avg. pretax income of Highest Quintile
140.3 135.7 134.7 134.7 139.2 148.9 152.9 172.5 162.5 174.8 173.9 168.8 162.9 170.1 170.2 173.6 181.8 190.9 202.3 214.7 227.5 236.5 213.9 203.3 210.1 227.8 246.7 256.0 264.7
avg. pretax income of All Quintiles
63.4 61.3 | 61.1 60.9 | 61.3
64.0 65.6| 70.4 68.0 71.0 71.6 70.8 69.0 | 70.8 | 71.1| 72.0 74.7 77.2 80.3 84.2 87.8 89.2 | 84.2 | 80.6 81.8 86.3 90.5 93.3 96.0
Avg. federal taxes paid by Top 1%
203.4 179.3 163.8 148.5 163.2 182.8 187.7 230.7 228.2 273.4 247.5 236.6 221.4 257.2 278.5 297.9 331.7 364.5 405.5 436.1 475.8 512.6 403.3 357.1 367.8 433.1 524.5 559.9 553.3
Avg. federal taxes paid by Top 5%
79.2 72.9 68.4 62.0 64.1
71.6 72.6 84.8 87.0 96.2 91.9 | 87.7 84.2 92.8 98.7 104.8 114.1 123.1 134.0 142.3 153.4 161.8 133.2 120.2 122.8 139.4 162.3 169.5 170.7
Avg. federal taxes paid by Top 10%
54.1
51.3
49.2 | 44,5 45,7
50.4 51.1| 57.9
59.9
64.5
62.7 60,3
58.4 62.6
66.2 69.8 74.5 80.3
85.9 90,4 97.5
101.8 86.3 79.1
79.5 88.6 99.9 104.2 105.2
Avg. federal taxes paid by Highest Quintile 38.6 37.0 | 36.2 | 32.8 33.2
36.1 36.7 41.0
41.9
44.8
43.9 42.4 41.3
43.5
45.6 47.5 50.6
53.5 56.6 59.3 63.7
66.2 | 57.1 52.9
52.4 57.5
63.5 66.1| 66.4
Avg. federal taxes paid by All Quintiles
14.1
13.6
13.7
12.6
12.5
13.4 13.7 14.7 14.7
15.5
15.4 15.2 14.8
15.2
15.7
16.0 16.8 17.6
18.4 19.0 20.1
20.5
18.0 16.7
16.2
17.3
18.6
19.3 19.6
avg. pre-tax income in thousands of $
avg. tax payments in thousands of $
Expert Solution
This question has been solved!
Explore an expertly crafted, step-by-step solution for a thorough understanding of key concepts.

This is a popular solution!

Trending now
This is a popular solution!

Step by step
Solved in 3 steps

Knowledge Booster


Learn more about
Need a deep-dive on the concept behind this application? Look no further. Learn more about this topic, economics and related others by exploring similar questions and additional content below.Recommended textbooks for you

Economics: Private and Public Choice (MindTap Cou…
Economics
ISBN:
9781305506725
Author:
James D. Gwartney, Richard L. Stroup, Russell S. Sobel, David A. Macpherson
Publisher:
Cengage Learning

Macroeconomics: Private and Public Choice (MindTa…
Economics
ISBN:
9781305506756
Author:
James D. Gwartney, Richard L. Stroup, Russell S. Sobel, David A. Macpherson
Publisher:
Cengage Learning
Economics: Private and Public Choice (MindTap Cou…
Economics
ISBN:
9781305506725
Author:
James D. Gwartney, Richard L. Stroup, Russell S. Sobel, David A. Macpherson
Publisher:
Cengage Learning
Macroeconomics: Private and Public Choice (MindTa…
Economics
ISBN:
9781305506756
Author:
James D. Gwartney, Richard L. Stroup, Russell S. Sobel, David A. Macpherson
Publisher:
Cengage Learning


Principles of Economics 2e
Economics
ISBN:
9781947172364
Author:
Steven A. Greenlaw; David Shapiro
Publisher:
OpenStax
