In 2010, shortly before a country's midterm elections, people in that country were dissatisfied with government and 57% of adults in the country thought that a third major party was needed. In a recent poll, 61% of 1059 adults in the country felt the same way At the 20% significance level, do the data provide sufficient evidence to conclude that the percentage of all adults in the country who now think that a third major party is needed has changed from that in 2010? Use the one-proportion z-test to perform the appropriate hypothesis test. Click here to view page 1 of the table Click here to view page 2 of the table of areas under the standard normal curve. areas under the standard normal curve. What are the hypotheses for the one-proportion z-test? (Type integers or decimals.) What is the test statistic? z= (Round to two decimal places as needed.) Identify the critical value(s). VN (Round to two decimal places as needed.) What is the correct conclusion for the hypothesis test? O A. Do not reject Ho, the data do provide sufficient evidence to conclude that the percentage has changed from 57%. O B. Reject Ho: the data do not provide sufficient evidence to conclude that the percentage has changed from 57%. OC. Do not reject H, the data do not provide sufficient evidence to conclude that the percentage has changed from 57%. O D. Reject Ho: the data do provide sufficient evidence to conclude that the percentage has changed from 57%.
In 2010, shortly before a country's midterm elections, people in that country were dissatisfied with government and 57% of adults in the country thought that a third major party was needed. In a recent poll, 61% of 1059 adults in the country felt the same way At the 20% significance level, do the data provide sufficient evidence to conclude that the percentage of all adults in the country who now think that a third major party is needed has changed from that in 2010? Use the one-proportion z-test to perform the appropriate hypothesis test. Click here to view page 1 of the table Click here to view page 2 of the table of areas under the standard normal curve. areas under the standard normal curve. What are the hypotheses for the one-proportion z-test? (Type integers or decimals.) What is the test statistic? z= (Round to two decimal places as needed.) Identify the critical value(s). VN (Round to two decimal places as needed.) What is the correct conclusion for the hypothesis test? O A. Do not reject Ho, the data do provide sufficient evidence to conclude that the percentage has changed from 57%. O B. Reject Ho: the data do not provide sufficient evidence to conclude that the percentage has changed from 57%. OC. Do not reject H, the data do not provide sufficient evidence to conclude that the percentage has changed from 57%. O D. Reject Ho: the data do provide sufficient evidence to conclude that the percentage has changed from 57%.

Glencoe Algebra 1, Student Edition, 9780079039897, 0079039898, 2018
18th Edition
ISBN:9780079039897
Author:Carter
Publisher:Carter
Chapter10: Statistics
Section: Chapter Questions
Problem 13PT

Related questions
Question
100%
8. Please answer
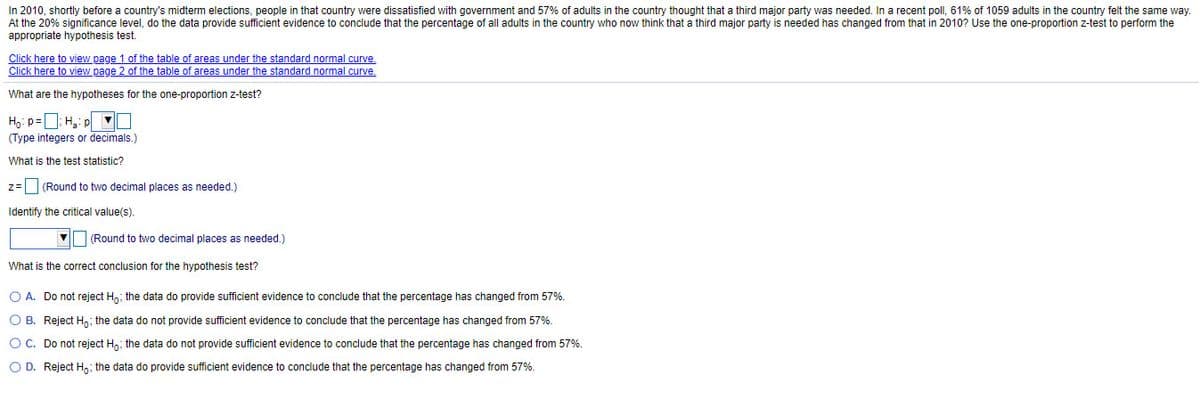
Transcribed Image Text:In 2010, shortly before a country's midterm elections, people in that country were dissatisfied with government and 57% of adults in the country thought that a third major party was needed. In a recent poll, 61% of 1059 adults in the country felt the same way
At the 20% significance level, do the data provide sufficient evidence to conclude that the percentage of all adults in the country who now think that a third major party is needed has changed from that in 2010? Use the one-proportion z-test to perform the
appropriate hypothesis test.
Click here to view page 1 of the table of areas under the standard normal curve.
Click here to view page 2 of the table of areas under the standard normal curve.
What are the hypotheses for the one-proportion z-test?
Ho: p=D; H,: p
(Type integers or decimals.)
What is the test statistic?
z= (Round to two decimal places as needed.)
Identify the critical value(s).
V (Round to two decimal places as needed.)
What is the correct conclusion for the hypothesis test?
O A. Do not reject Hn; the data do provide sufficient evidence to conclude that the percentage has changed from 57%.
O B. Reject H,; the data do not provide sufficient evidence to conclude that the percentage has changed from 57%.
OC. Do not reject Hn; the data do not provide sufficient evidence to conclude that the percentage has changed from 57%.
O D. Reject H,; the data do provide sufficient evidence to conclude that the percentage has changed from 57%.
Expert Solution
This question has been solved!
Explore an expertly crafted, step-by-step solution for a thorough understanding of key concepts.

This is a popular solution!

Trending now
This is a popular solution!

Step by step
Solved in 3 steps with 1 images

Knowledge Booster


Learn more about
Need a deep-dive on the concept behind this application? Look no further. Learn more about this topic, statistics and related others by exploring similar questions and additional content below.Recommended textbooks for you
Glencoe Algebra 1, Student Edition, 9780079039897…
Algebra
ISBN:
9780079039897
Author:
Carter
Publisher:
McGraw Hill

Holt Mcdougal Larson Pre-algebra: Student Edition…
Algebra
ISBN:
9780547587776
Author:
HOLT MCDOUGAL
Publisher:
HOLT MCDOUGAL

College Algebra (MindTap Course List)
Algebra
ISBN:
9781305652231
Author:
R. David Gustafson, Jeff Hughes
Publisher:
Cengage Learning
Glencoe Algebra 1, Student Edition, 9780079039897…
Algebra
ISBN:
9780079039897
Author:
Carter
Publisher:
McGraw Hill
Holt Mcdougal Larson Pre-algebra: Student Edition…
Algebra
ISBN:
9780547587776
Author:
HOLT MCDOUGAL
Publisher:
HOLT MCDOUGAL
College Algebra (MindTap Course List)
Algebra
ISBN:
9781305652231
Author:
R. David Gustafson, Jeff Hughes
Publisher:
Cengage Learning
