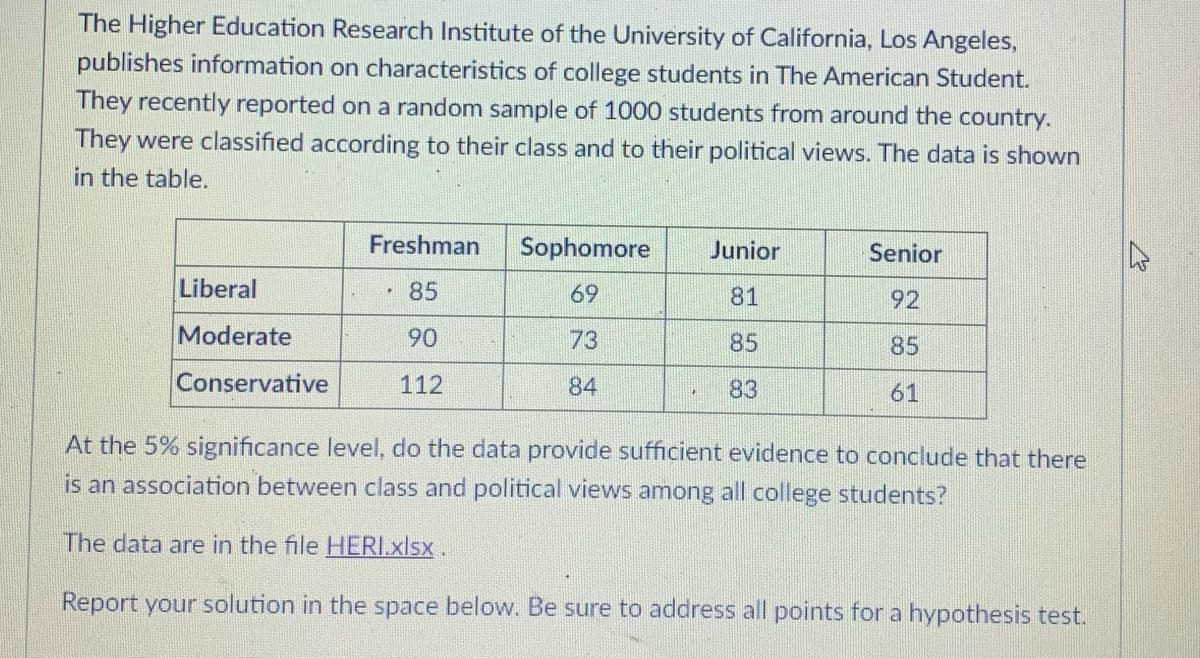
The Higher Education Research Institute of the University of California, Los Angeles, publishes information on characteristics of college students in The American Student. They recently reported on a random sample of 1000 students from around the country. They were classified according to their class and to their political views. The data is shown in the table. Freshman Sophomore Junior Senior Liberal - 85 69 81 92 Moderate 90 73 85 85 Conservative 112 84 83 61 At the 5% significance level, do the data provide sufficient evidence to conclude that there is an association between class and political views among all college students? The data are in the file HERI.xlsx. Report your solution in the space below. Be sure to address all points for a hypothesis test.
The Higher Education Research Institute of the University of California, Los Angeles, publishes information on characteristics of college students in The American Student. They recently reported on a random sample of 1000 students from around the country. They were classified according to their class and to their political views. The data is shown in the table. Freshman Sophomore Junior Senior Liberal - 85 69 81 92 Moderate 90 73 85 85 Conservative 112 84 83 61 At the 5% significance level, do the data provide sufficient evidence to conclude that there is an association between class and political views among all college students? The data are in the file HERI.xlsx. Report your solution in the space below. Be sure to address all points for a hypothesis test.

MATLAB: An Introduction with Applications
6th Edition
ISBN:9781119256830
Author:Amos Gilat
Publisher:Amos Gilat
Chapter1: Starting With Matlab
Section: Chapter Questions
Problem 1P

Related questions
Question
Transcribed Image Text:The Higher Education Research Institute of the University of California, Los Angeles,
publishes information on characteristics of college students in The American Student.
They recently reported on a random sample of 1000 students from around the country.
They were classified according to their class and to their political views. The data is shown
in the table.
Freshman
Sophomore
Junior
Senior
Liberal
85
69
81
92
Moderate
90
73
85
85
Conservative
112
84
83
61
At the 5% significance level, do the data provide sufficient evidence to conclude that there
is an association between class and political views among all college students?
The data are in the file HERI.xlsx.
Report your solution in the space below. Be sure to address all points for a hypothesis test.
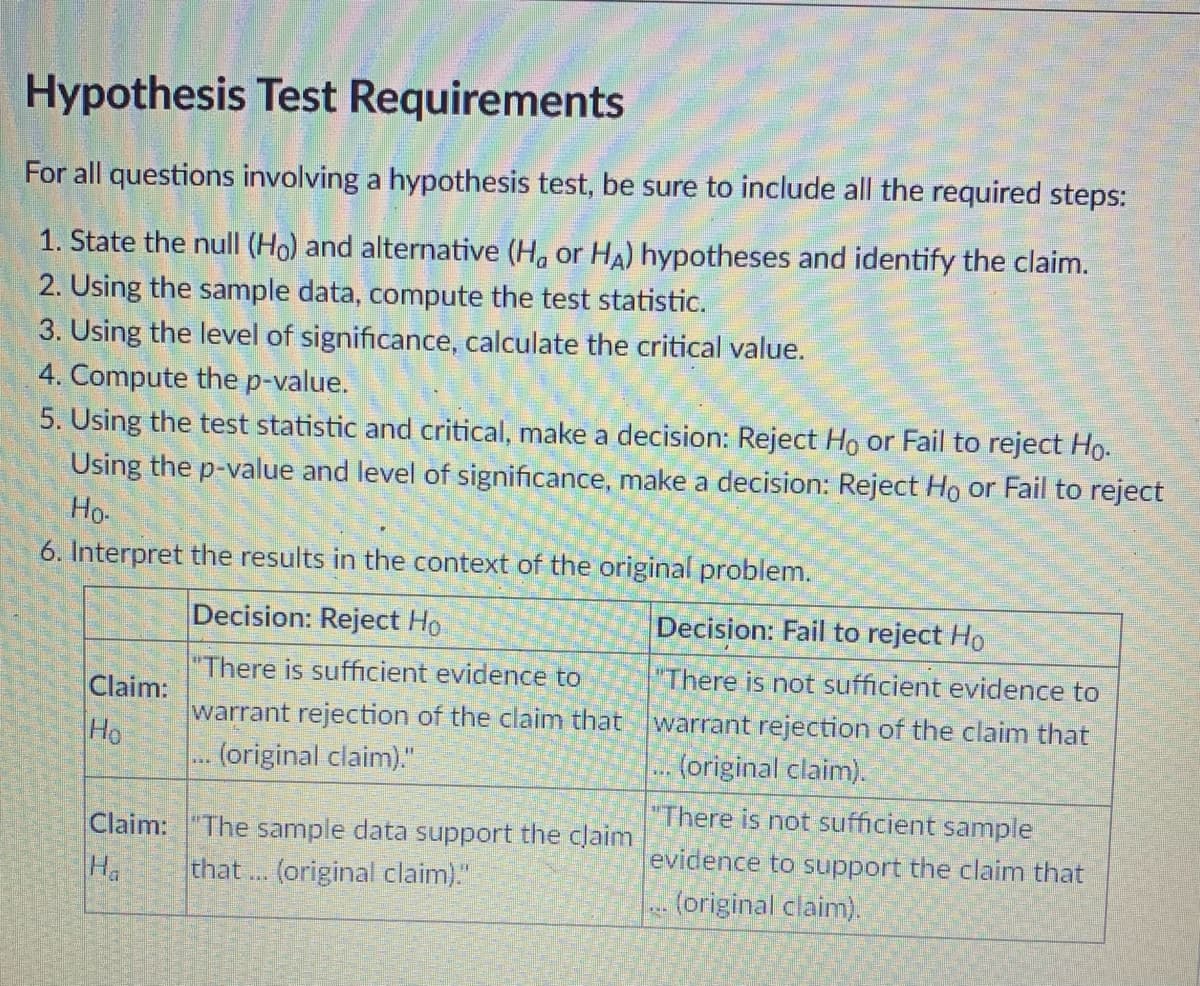
Transcribed Image Text:Hypothesis Test Requirements
For all questions involving a hypothesis test, be sure to include all the required steps:
1. State the null (Ho) and alternative (H or HA) hypotheses and identify the claim.
2. Using the sample data, compute the test statistic.
3. Using the level of significance, calculate the critical value.
4. Compute the p-value.
5. Using the test statistic and critical, make a decision: Reject Ho or Fail to reject Ho.
Using the p-value and level of significance, make a decision: Reject Ho or Fail to reject
Ho.
6. Interpret the results in the context of the original problem.
Decision: Reject Ho
Decision: Fail to reject Ho
Claim:
"There is sufficient evidence to
warrant rejection of the claim that
(original claim)."
"There is not sufficient evidence to
warrant rejection of the claim that
.... (original claim).
Ho
www
Claim:
"The sample data support the claim
that ... (original claim)."
"There is not sufficient sample
evidence to support the claim that
(original claim).
Ha
Expert Solution
This question has been solved!
Explore an expertly crafted, step-by-step solution for a thorough understanding of key concepts.

Step by step
Solved in 4 steps with 3 images

Recommended textbooks for you
MATLAB: An Introduction with Applications
Statistics
ISBN:
9781119256830
Author:
Amos Gilat
Publisher:
John Wiley & Sons Inc

Probability and Statistics for Engineering and th…
Statistics
ISBN:
9781305251809
Author:
Jay L. Devore
Publisher:
Cengage Learning

Statistics for The Behavioral Sciences (MindTap C…
Statistics
ISBN:
9781305504912
Author:
Frederick J Gravetter, Larry B. Wallnau
Publisher:
Cengage Learning
MATLAB: An Introduction with Applications
Statistics
ISBN:
9781119256830
Author:
Amos Gilat
Publisher:
John Wiley & Sons Inc
Probability and Statistics for Engineering and th…
Statistics
ISBN:
9781305251809
Author:
Jay L. Devore
Publisher:
Cengage Learning
Statistics for The Behavioral Sciences (MindTap C…
Statistics
ISBN:
9781305504912
Author:
Frederick J Gravetter, Larry B. Wallnau
Publisher:
Cengage Learning

Elementary Statistics: Picturing the World (7th E…
Statistics
ISBN:
9780134683416
Author:
Ron Larson, Betsy Farber
Publisher:
PEARSON

The Basic Practice of Statistics
Statistics
ISBN:
9781319042578
Author:
David S. Moore, William I. Notz, Michael A. Fligner
Publisher:
W. H. Freeman

Introduction to the Practice of Statistics
Statistics
ISBN:
9781319013387
Author:
David S. Moore, George P. McCabe, Bruce A. Craig
Publisher:
W. H. Freeman