In a certain jurisdiction, all students in Grade Three are required to take a standardized test to evaluate their math comprehension skills. The attached contains these data resulting from a random sample of n=40 schools within this jurisdiction. From these data you wish to estimate the model Yi=β0+β1Xi+ei where Xi is the percentage of Grade Three students in School i who live below the poverty line and Yi is the average mathematics comprehension score for


The attached contains these data resulting from a random sample of n=40 schools within this jurisdiction. From these data you wish to estimate the model
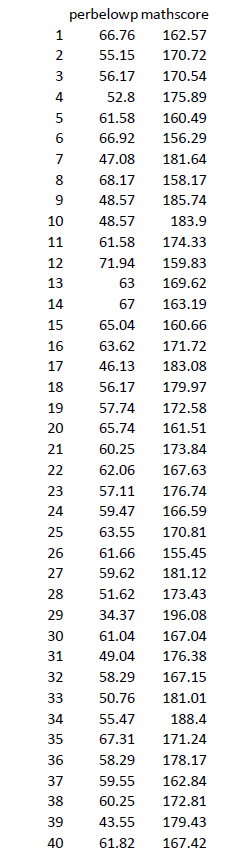
where Xi is the percentage of Grade Three students in School i who live below the poverty line and Yi is the average mathematics comprehension score for all Grade Three students in the same school, School i. The observed data for the X variable is labled perbelowpoverty and the obvserved data for the Y variable is labeled mathscore in the .csv file.
Import (either hand type or load the file) data into R Studio, then answer the following questions based on the data.
(a) Create a
From the plot, it appears that the relationship between the Grade Three mathematics comprehension test score and the percentage of Grade Three students living below the poverty line is:
(b) Compute the
(c) Fill in the blanks to estimate the model that estimates a school's average Grade Three mathematics comprehension score based on its linear relationship to the percentage of Grade Three students in the school who live below the poverty-line. Use as many decimals.
Y^i = _____________ +/- _____________Xi
(d) The percentage of children attending Grade Three who live below the poverty-line at School A is 60%. Using the regression equation you found in part (c), predict the average mathematics comprehension score of School A's Grade Three students.
Y^i = _______(use as many decimals)
(e) At School B, the percentage of Grade Three students living below the poverty line is 59%. What can you say about the average mathematics comprehension score of School B's Grade Three students compared to School A's Grade Three students? Complete the statement below.
The mathematics comprehension scores of all Grade Three students at School B will be:
A. Higher
B. Lower
C. the same
than the mathematics comprehension scores of all Grade Three students at School A by:
A. a value
B. an average
C. a median
of _________
(f) Complete the statement below about the coefficent of determination.
A. Variation
B. Average or Mean
C. Mean
in the:
A. Percentage of students living below the poverty line
B. Average mathematics comprehension score
can be explained by its:
A. linear relationship
B. nonlinear relationship
C. relationship
with the:
A. Percentage of students living below the poverty line
B. Average mathematics comprehension score
(Use as many decimals as possible in your percentage value)
(g) Complete this sentence concerning the condition of homoscedasticity (constant/consistant variance).
We can say that the condition of homoscedasticity is met if:
A. The Variation
B. The average or Mean
C. The mean
of the:
A. Percentage of students living below the poverty line
B. Average mathematics comprehension score
is:
A. The same
B. Not the same
regardless of the value of the:
A. Percentage of students living below the poverty line
B. Average mathematics comprehension score


Trending now
This is a popular solution!

Step by step
Solved in 4 steps


