In a certain school district, it was observed that 35% of the students in the element schools were classified as only children (no siblings). However, in the special program for talented and gifted children, 160 out of 387 students are only children. The school district administrators want to know if the proportion of only children in the special program is significantly different from the proportion for the school district. Test at the a = 0.05 level of significance.
In a certain school district, it was observed that 35% of the students in the element schools were classified as only children (no siblings). However, in the special program for talented and gifted children, 160 out of 387 students are only children. The school district administrators want to know if the proportion of only children in the special program is significantly different from the proportion for the school district. Test at the a = 0.05 level of significance.

Glencoe Algebra 1, Student Edition, 9780079039897, 0079039898, 2018
18th Edition
ISBN:9780079039897
Author:Carter
Publisher:Carter
Chapter10: Statistics
Section10.6: Summarizing Categorical Data
Problem 30PPS

Related questions

Concept explainers
Contingency Table
A contingency table can be defined as the visual representation of the relationship between two or more categorical variables that can be evaluated and registered. It is a categorical version of the scatterplot, which is used to investigate the linear relationship between two variables. A contingency table is indeed a type of frequency distribution table that displays two variables at the same time.
Binomial Distribution
Binomial is an algebraic expression of the sum or the difference of two terms. Before knowing about binomial distribution, we must know about the binomial theorem.
Topic Video
Question
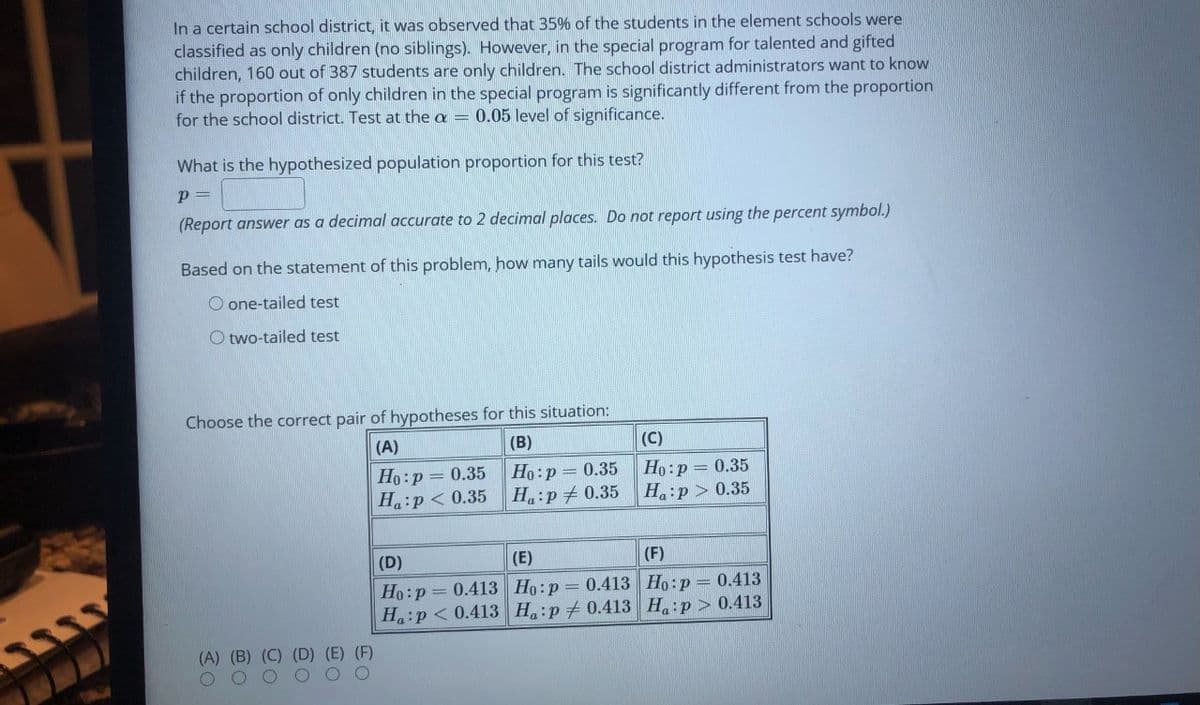
Transcribed Image Text:In a certain school district, it was observed that 35% of the students in the element schools were
classified as only children (no siblings). However, in the special program for talented and gifted
children, 160 out of 387 students are only children. The school district administrators want to know
if the proportion of only children in the special program is significantly different from the proportion
for the school district. Test at the a = 0.05 level of significance.
What is the hypothesized population proportion for this test?
p =
(Report answer as a decimal accurate to 2 decimal places. Do not report using the percent symbol.)
Based on the statement of this problem, how many tails would this hypothesis test have?
O one-tailed test
O two-tailed test
Choose the correct pair of hypotheses for this situation:
(A)
(B)
(C)
Но: р— 0.35
Ha:p < 0.35
Но: р — 0.35
H:p+ 0.35
Но:р— 0.35
Haip> 0.35
(D)
(E)
(F)
Ho:p= 0.413 Ho:p 0.413 Ho:p 0.413
Ha:p< 0.413 H.:p 0.413 Ha p> 0.413
(A)
(E) (F)
Co
30
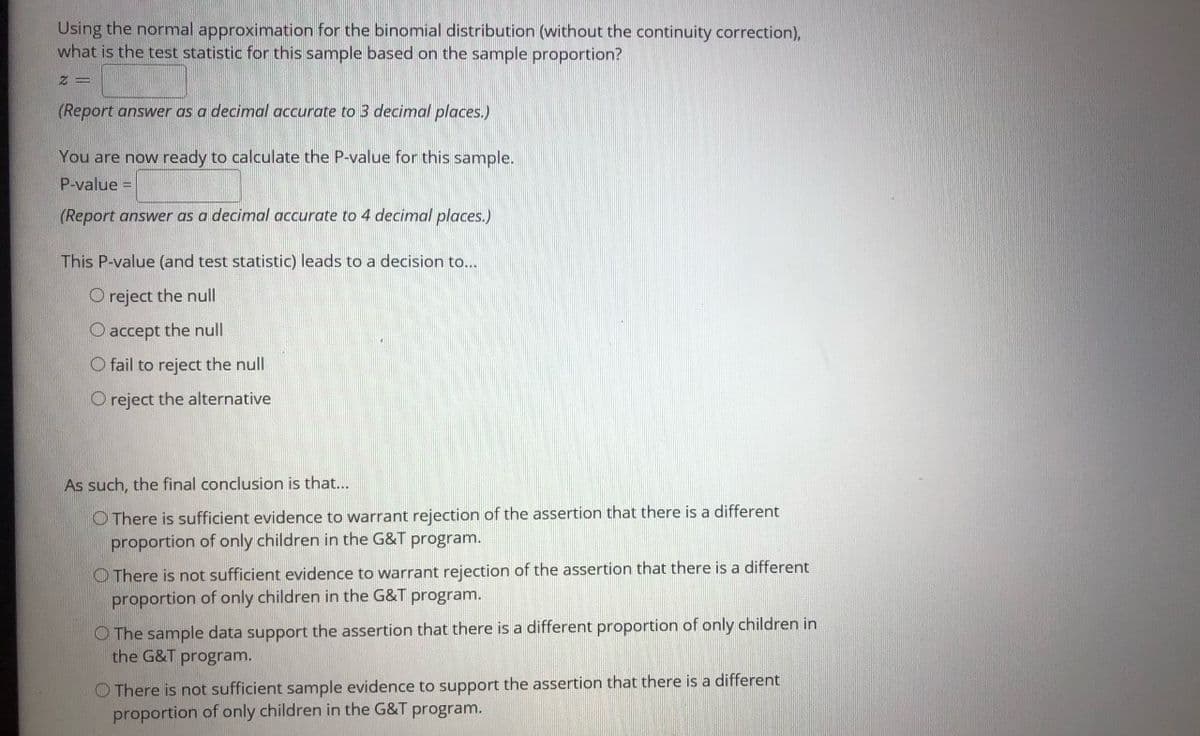
Transcribed Image Text:Using the normal approximation for the binomial distribution (without the continuity correction),
what is the test statistic for this sample based on the sample proportion?
(Report answer as a decimal accurate to 3 decimal places.)
You are now ready to calculate the P-value for this sample.
P-value =
(Report answer as a decimal accurate to 4 decimal places.)
This P-value (and test statistic) leads to a decision to..
O reject the null
O accept the null
O fail to reject the null
O reject the alternative
As such, the final conclusion is that...
O There is sufficient evidence to warrant rejection of the assertion that there is a different
proportion of only children in the G&T program.
O There is not sufficient evidence to warrant rejection of the assertion that there is a different
proportion of only children in the G&T program.
O The sample data support the assertion that there is a different proportion of only children in
the G&T program.
O There is not sufficient sample evidence to support the assertion that there is a different
proportion of only children in the G&T program.
Expert Solution
This question has been solved!
Explore an expertly crafted, step-by-step solution for a thorough understanding of key concepts.

This is a popular solution!

Trending now
This is a popular solution!

Step by step
Solved in 3 steps with 2 images

Knowledge Booster


Learn more about
Need a deep-dive on the concept behind this application? Look no further. Learn more about this topic, statistics and related others by exploring similar questions and additional content below.Recommended textbooks for you
Glencoe Algebra 1, Student Edition, 9780079039897…
Algebra
ISBN:
9780079039897
Author:
Carter
Publisher:
McGraw Hill

Holt Mcdougal Larson Pre-algebra: Student Edition…
Algebra
ISBN:
9780547587776
Author:
HOLT MCDOUGAL
Publisher:
HOLT MCDOUGAL

College Algebra (MindTap Course List)
Algebra
ISBN:
9781305652231
Author:
R. David Gustafson, Jeff Hughes
Publisher:
Cengage Learning
Glencoe Algebra 1, Student Edition, 9780079039897…
Algebra
ISBN:
9780079039897
Author:
Carter
Publisher:
McGraw Hill
Holt Mcdougal Larson Pre-algebra: Student Edition…
Algebra
ISBN:
9780547587776
Author:
HOLT MCDOUGAL
Publisher:
HOLT MCDOUGAL
College Algebra (MindTap Course List)
Algebra
ISBN:
9781305652231
Author:
R. David Gustafson, Jeff Hughes
Publisher:
Cengage Learning
