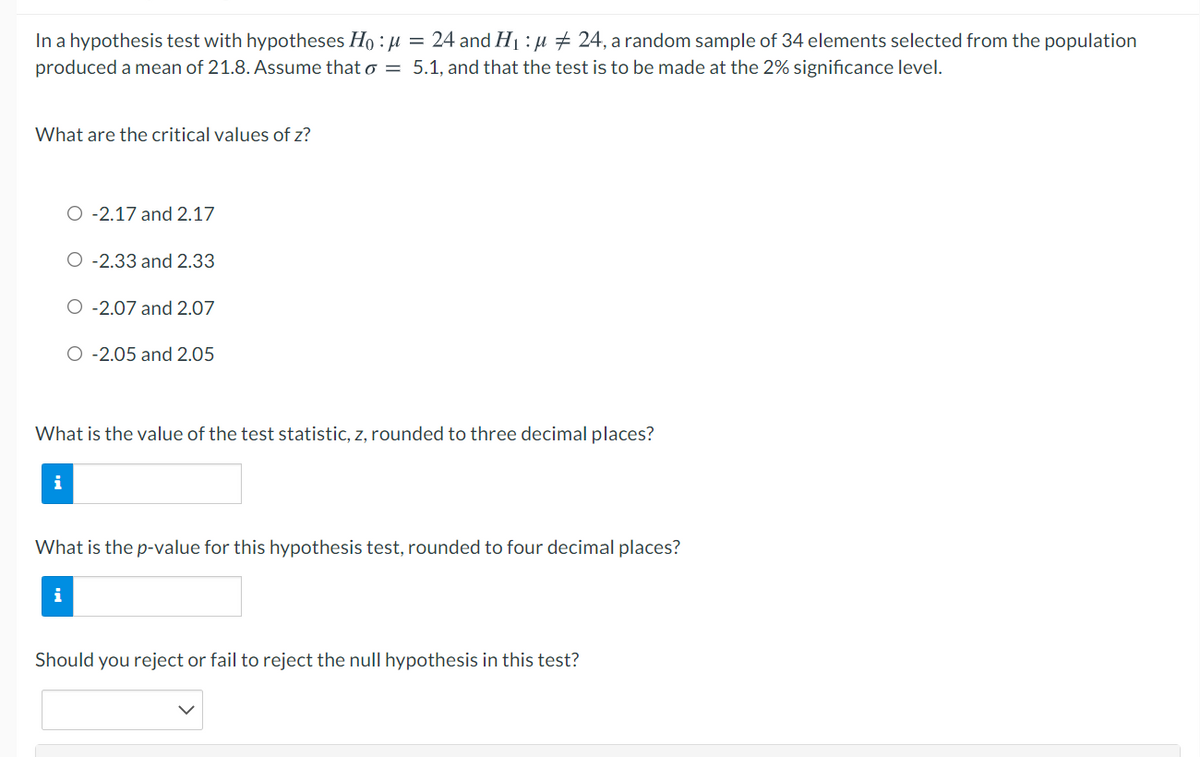
In a hypothesis test with hypotheses Ho : µ = 24 and H1 : µ # 24, a random sample of 34 elements selected from the population produced a mean of 21.8. Assume that o = 5.1, and that the test is to be made at the 2% significance level.
Q: The test statistic of z = 1.82 is obtained when testing the claim that p = 0.674. a. Identify the…
A: Solution: Given information: Test statistic: z = 1.82 Claim: p≠0.674 To test the hypothesis…
Q: The test statistic of z = 1.53 is obtained when testing the claim that p 0.414. a. Identify the…
A:
Q: The test statistic of z 2.00 is obtained when testing the claim that p 0.639. a Identify the…
A: It is given that, z =2.00 and researcher claim that p≠0.639
Q: For the hypergeometric experiment that has a population sre N 12, with a number of successes m- 10,…
A:
Q: In a hypothesis test with the null and alternative hypotheses Ho: 45 , a random sample of 69…
A: Hypothesis Ho: μ≤45 vs H1:μ>45 n=sample size=69, sample mean x̄=47.3, population standard…
Q: In a hypothesis test with the null and alternative hypotheses Ho: u 45, a random sample of 69…
A:
Q: For the hypothesis test Ho : u = 23 against H1 : µ < 23 with variance unknown and n = 12, find the…
A:
Q: In a hypothesis test with hypotheses Ho : µ = 90 and H1 : µ # 90, a random sample of 103 elements…
A: According to the given information, we have Mean = 94.3 Standard deviation = 22.1 Sample size = 103
Q: To evaluate the effect of a treatment, a sample is obtained from a population with a mean of µ=20,…
A: Given data µ=20 M = 21.3 s² = 9 α=.05 n = 16 Formulation of Hypothesis Null Hypothesis: H0: µ = 20…
Q: The test statistic of z = 2.27 is obtained when testing the claim that p>0.3. a. Identify the…
A: Given : Test Statistic , z = 2.27 Claim : Alternate Hypothesis : p > 0.3 a) This corresponds to…
Q: g. With which p level-0.05 or 0.01 reject the null hypothesis? Explain.
A: While conducting a Z-test, the 6 steps of hypothesis testing are: i) Identifying the population and…
Q: An automobile mileage study tested the following hypotheses. Hypothesis Conclusion Ho: 4 2 25 mpg…
A: Power given power of a test we have to find the sample size.
Q: In a random sample of 400 residents, 220 support a 0.3% sales tax increase to build a new high…
A: The hypothesized proportion is 0.50.
Q: analyst tested the null hypothesis µ ≥ 30 against the alternative hypothesis that µ 0.05 0.05 0.07…
A: Here we want to know level of significance to reject the null hypothesis.
Q: In a hypothesis test with hypotheses Ho : u = 90 and H1 : µ # 90, a random sample of 103 elements…
A:
Q: In a hypothesis test with hypotheses H0 : P greater than equal 0.76 and H1 : P less than 0.76 , a…
A: Denote p as the true population proportion. The null and alternative hypotheses are: Null…
Q: The thicknesses of n = 41 glass sheets made using process A are measured and the statistics x = 3.04…
A: The random variable thickness follows normal distribution. There are two independent samples which…
Q: The test statistic of z = 1.97 is obtained when testing the claim that p>0.7. a. Identify the…
A: Given, Z score = 1.97
Q: In a hypothesis test with hypotheses Ho : H = 90 and H1 : H # 90, a random sample of 16 elements…
A:
Q: In a random sample, 12 of 14 industrial accidents weredue to unsafe working conditions. Use the 0.01…
A:
Q: To evaluate the effect of a treatment, a sample of n = 8 is obtained from a population with a mean…
A: a. Consider that μ defines the population mean. Null hypothesis: H0: μ = 50. Alternative…
Q: In a hypothesis test with hypotheses Ho:H = 90 and H1:H # 90, a random sample of 16 elements…
A:
Q: With H1: p < 0.32, a test statistic is z = -1.23. Use a 0.01 significance level to find the…
A: Given that,null, Ho:p=0.32 alternate, H1: p<0.32level of significance, alpha = 0.01
Q: The test statistic of z =0.89 is obtained when testing the claim that p>0.1. a. Identify the…
A: GivenTest statistic(z)=0.89claim is p>0.1significance level(α)=0.01
Q: To evaluate the effect of a treatment, a sample of n = 8 is obtained from a population with a mean…
A: 1. The null and alternative hypothesis are given by : Ho : μ=50H1 : μ≠50 The test statistics is…
Q: A bottling company claims that on average, their bottles are filled with at least 16.1 ounces of…
A: For the given data Perform z test for one mean
Q: In a hypothesis test with the null and alternative hypotheses hypotheses Ho : µ > 80 and H1 : µ <…
A:
Q: The test statistic of z = 2.47 is obtained when testing the claim that p > 0.8. Identify the…
A: Solution: The given claim is that p>0.8 and the test statistic is z=2.47.
Q: In a hypothesis test with the null and alternative hypotheses Ho: 60 and H:# # 60, a random sample…
A: Given that Hypothesized Population Mean (\mu)(μ) = 6060 Population Standard Deviation…
Q: The test statistic of z = 2.05 is obtained when testing the claim that p > 0.4. Identify the…
A: The test statistic is z=2.05 The claim is p > 0.4 α=0.10
Q: The test statistic of z=2.77 is obtained when testing the claim that p≠0.684. a. Identify the…
A: (a) The null and alternative hypothesis is, Level of significance, α=0.10 The type of test is two…
Q: An independent-measures research study uses two samples, each with n = 10 participants. If the data…
A:
Q: In a hypothesis test with hypotheses Ho: μ ≤ 54 and H1: μ > 54, a random sample of 24 elements…
A: Consider that μ is the population mean.
Q: If you have a hypothesis test with alpha = 0.04, which of the following P-Values does NOT imply…
A: It is known that, if P-value is less than or equal to the level of significance, the test is…
Q: In a hypothesis test with hypotheses Ho :p 2 0.76 and H1 :p < 0.76, a random sample of size 974…
A:
Q: In a hypothesis test with hypotheses Ho :H 2 80 and Hi :H < 80, a random sample of 110 elements…
A:
Q: The test statistic of z = 0.54 is obtained when testing the claim that p > 0.5. Identify the…
A: Given that Claim : p>0.50 Level of significance (α)=0.05 Test statistic (z) = 0.54
Q: The test statistic of z=1.79 is obtained when testing the claim that p≠0.576. a. Identify the…
A: From the provided information, The test statistic (z) = 1.79 Claim p ≠ 0.576
Q: In an experiment to determine which of the three different missile systems is preferable, the…
A: Kruskal wallis test is the type of non parametric test. It is an alternative test for one way anova.…
Q: If you have a hypothesis test with alpha = 0.1, which of the following P-Values does NOT imply…
A:
Q: Test the null hypothesis H0:μ=3.9 against the alternative hypothesis HA:μ≠3.9, based on a random…
A: Given,sample size(n)=29sample mean(x¯)=4.1standard deviation(σ)=0.89H0:μ=3.9HA:μ≠3.9
Q: In testing hypotheses, which of the following would be strong evidence against the null hypothesis?…
A: Basics:
Q: Find the value of the standard score, z, and determine whether to reject the null hypothesis at a…
A: Given that Null hypothesis H0 : μ=19.1 meters Alternative hypothesis H1 : μ≠19.1 meters Sample size…
Q: In a hypothesis test with hypotheses H. = 24 and H.: u 24, a random sample of 50 elements selected…
A: Given: σ=4.4n=50x¯=25.3μ=24 The test statistic is obtained as below: z=sample statistic-Null…
Q: In a hypothesis test with hypotheses Ho : µ = 24 and H1 : µ # 24, a random sample of 38 elements…
A: The given sample has a size n=38, the sample mean is x¯=26 and the population standard deviation is…
Q: In a hypothesis test with the null and alternative hypotheses hypotheses Ho : µ > 80 and H1 : µ <…
A: Given: n= 99.0 ,x̄= 75.3 ,σ= 24.6 µ= 80.0 ,significance level(∝)= 0.05 define hypothesis;- Null…
Q: The test statistic of z = 2.08 is obtained when testing the claim that p> 0.3. a. Identify the…
A: a. The claim indicates the greater than symbol this shows that the hypothesis test is being…
Q: If, in a one-tail hypothesis test where H0 is only rejected in the upper tail, the p-value=0.6792…
A: Given information: In a one-tail hypothesis test where H0 is only rejected in the upper tail, the…
Q: The test statistic of z 1.26 is obtained when testing the claim that p>0.2. a. Identify the…
A: a. The test statistic of z=1.26 and the claim of the test is p>0.2. The claim shows the symbol…
Q: The test statistic of z=2.75 is obtained when testing the claim that p≠0.317. a. Identify the…
A: For a given fraction of the population, termed as sample proportion, we use z- test to test a…
Step by step
Solved in 2 steps
- Assume that you have a sample of n1=8, with the sample mean X1=44, and a sample standard deviation of S1=5, and you have an independent sample of n2=14 from another population with a sample mean of X2=30 and the sample standard deviation S2=6. Using a significance level of α=0.025, what is the critical value for a one-tail test of the hypothesis H0: μ1≤ μ2 against the alternative H1: μ1>μ2? The critical value is ______ (Round to two decimal places as needed.)In a hypothesis test with hypotheses H0 :pless than or greater than 0.58 and H1 >0.58 , a random sample of size 1,165 produced a sample proportion of 0.6160. The test is to be made at the 2.5% significance level. What is the value of the test statistic, z, rounded to three decimal places?A nationwide study of undergraduate students reported that the mean number of drinks consumed per week during the spring semester is 7.96. The mean number of drinks consumed per week at USC is 7.64 (s.d.=2.55, N=412 Health services is concerned that USC students are consuming significantly more alcohol per week than the national average. Using an alpha level of .05, Is there sufficient evidence to be concerned? Be sure to select the correct critical value for the alternative hypothesis, and then use this evidence to make your conclusion
- 31% of all pygmy softshell tortoises have stripes on their shells. A herpetologist in Cititon collects a sample of 28 pygmy softshell tortoises and finds that 8 of them have stripes on their shells. Is there enough evidence to conclude, at a significance of alpha = 0.05, that the proportion of pygmy softshell tortoises in Cititon with stripes on their shells is less than 31%? What is the claim? What is the null hypothesis? What is the alternative hypothesis? What is the test statistic? What is/are the critical value(s)? Do we reject the null hypothesis? What conclusion do we draw? What is the P-value for the problem above?To evaluate the effect of a treatment, one sample of n=8 is obtained from a population with population mean: u=40 and the treatment is administered to the individuals in the sample. After treatment, the sample mean is found to be M=35. 1. If the sample variance is s^2=32, are the data sufficient to conclude that the treatment has a significant effect using a two-tailed test with alpha=.05? (show work please, and state both experimental and statistical hypotheses, and state your decision regarding the H0. (all 4 steps of hypothesis test) 2a. If the sample variance is s^2=72, are the data sufficient to conclude that the treatment has a significant effect using a two-tailed test with alpha=.05? (please show your work and state your decision regarding the H0.) 2b. Calculate Effect size by using r^2 (percentage of variance explained) and state the meaning of effect size.(1) Conduct a hypothesis test, at the 5% level of significance, to determine whether ? is significant (2) What would be the growth of the plant if 4g of fertilizer and 7g of ater was given to it daily? (3) Carry out an F -test at the 1% significance level to determine whether the model is significant
- A researcher who wants to know whether the proportion of male births in a hospital is different from the established baseline of 51.07%, would like to test the following hypotheses: Ho:P = 0.51 vs. Ha :P = does not equal 0.51 a) Is the alternative hypothesis upper tail, lower tail, or two tailed? b) What do you conclude if the test results p-value of 0.03 at alpha value = 5% c) What do you conclude if the test results p-value of 0.08 at alpha value = 10%An electrical engineer wishes to determine if, among two specific municipal buildings in town, Building “North” and Building “South”, whether the tensile strength of pipes (in psi) is not the same in each of these two buildings. A sample of pipes was chosen at random from both Building “North” and Building “South”, respectively. Using α = 0.05, which of the following statistical test, or parameter, would be best for determining whether tensile strength of pipes (in psi) is not the same in each of these two buildings? (Assume all statistical assumptions met.) a) Binomial Distribution b) Population Difference in Means (i.e., Unpaired Data) c) The Chi-Squared Test of Independence d) Population Mean Difference (i.e., Paired Data)Q1/ Consider the following hypothesis test : H0:μ 65 Ha:μ 65 A sample of size 15 provided a sample mean (63) and population standard deviation is (2). a-Compute the test statistic. b-Compute p-value from the table? What is the rejection rule ? and what is your conclusion at α=0.05? c-What is the rejection rule ,using critical vale approach? What is your conclusion at α=0.05? .............................................................................................................................. Q2/ Consider the following hypothesis test : H0:μ =12.5 Ha:μ ‡12.5 A sample of size 18 provided a sample mean (12.9) and sample standard deviation is (0.8). a-Compute the test statistic. b-Determine the range of p-value from the table of t-distribution? What is the rejection rule ?
- Q1/Consider the following hypothesis test : H0:μ 65 Ha:μ 65 A sample of size 15 provided a sample mean (63) and population standard deviation is (2). a-Compute the test statistic. b-Compute p-value from the table? What is the rejection rule ? and what is your conclusion at α=0.05? c-What is the rejection rule ,using critical vale approach? What is your conclusion at α=0.05? ........................................................................................................................ Q2 /Consider the following hypothesis test : H0:μ =12.5 Ha:μ ‡12.5 A sample of size 18 provided a sample mean (12.9) and sample standard deviation is (0.8). a-Compute the test statistic. b-Determine the range of p-value from the table of t-distribution? What is the rejection rule ?If, in a one-tail hypothesis test where H0 is only rejected in the upper tail, the p-value=0.6792 and ZSTAT=−0.47,what is the statistical decision if the null hypothesis is tested at the 0.07 level of significance? What is the statistical decision? Since the p-value is Less than or Greater than or equal to a= , Reject , Do not reject H0.In a test of H0: p = 0.8 against H1: p ≠ 0.8, a sample of size 1000 produces Z = 2.05 for the value of the test statistic. Thus the p-value (or observed level of significance) of the test is approximately equal to: