Regression. A coach wants to see the relationship between the statistics of practice games and official games of a local soccer team. A sample of 24 players was used and the resulting (partial) Excel output is shown below. Assume both x and y form normal distributions. Regression Statistics Multiple R *** R Square Adjusted R Square 0.668395 0.70524 Standard Error 8.703633 Observations 24 Coefficients Standard t Stat P-value Lower Upper 95% Error 95% Intercept 40.63461 8.506861 4.794266 0.001366 21.1673 60.40101 Midterm 0.718205 0.174917 4.379587 0.002365 0.362046 1.169078 (a) The slope of the regression line is O A. 0.175 O B. 4.38
Regression. A coach wants to see the relationship between the statistics of practice games and official games of a local soccer team. A sample of 24 players was used and the resulting (partial) Excel output is shown below. Assume both x and y form normal distributions. Regression Statistics Multiple R *** R Square Adjusted R Square 0.668395 0.70524 Standard Error 8.703633 Observations 24 Coefficients Standard t Stat P-value Lower Upper 95% Error 95% Intercept 40.63461 8.506861 4.794266 0.001366 21.1673 60.40101 Midterm 0.718205 0.174917 4.379587 0.002365 0.362046 1.169078 (a) The slope of the regression line is O A. 0.175 O B. 4.38

MATLAB: An Introduction with Applications
6th Edition
ISBN:9781119256830
Author:Amos Gilat
Publisher:Amos Gilat
Chapter1: Starting With Matlab
Section: Chapter Questions
Problem 1P

Related questions
Question
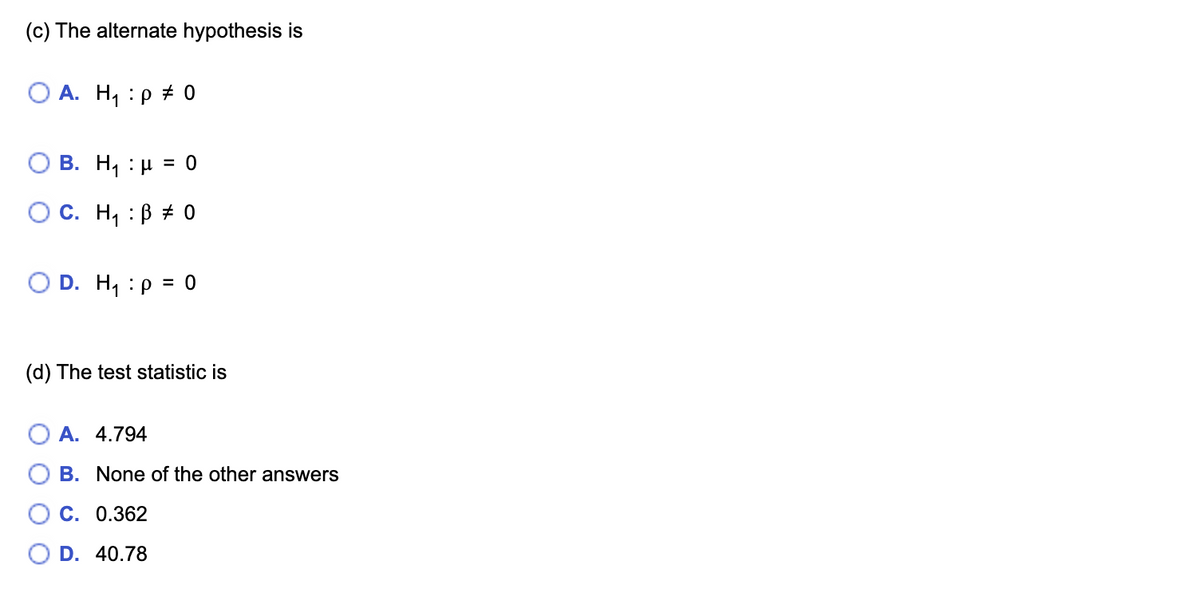
Transcribed Image Text:(c) The alternate hypothesis is
O A. H, :p + 0
В. Н : и
= 0
О С. Н : В # 0
O D. H, :p = 0
(d) The test statistic is
O A. 4.794
B. None of the other answers
C. 0.362
O D. 40.78
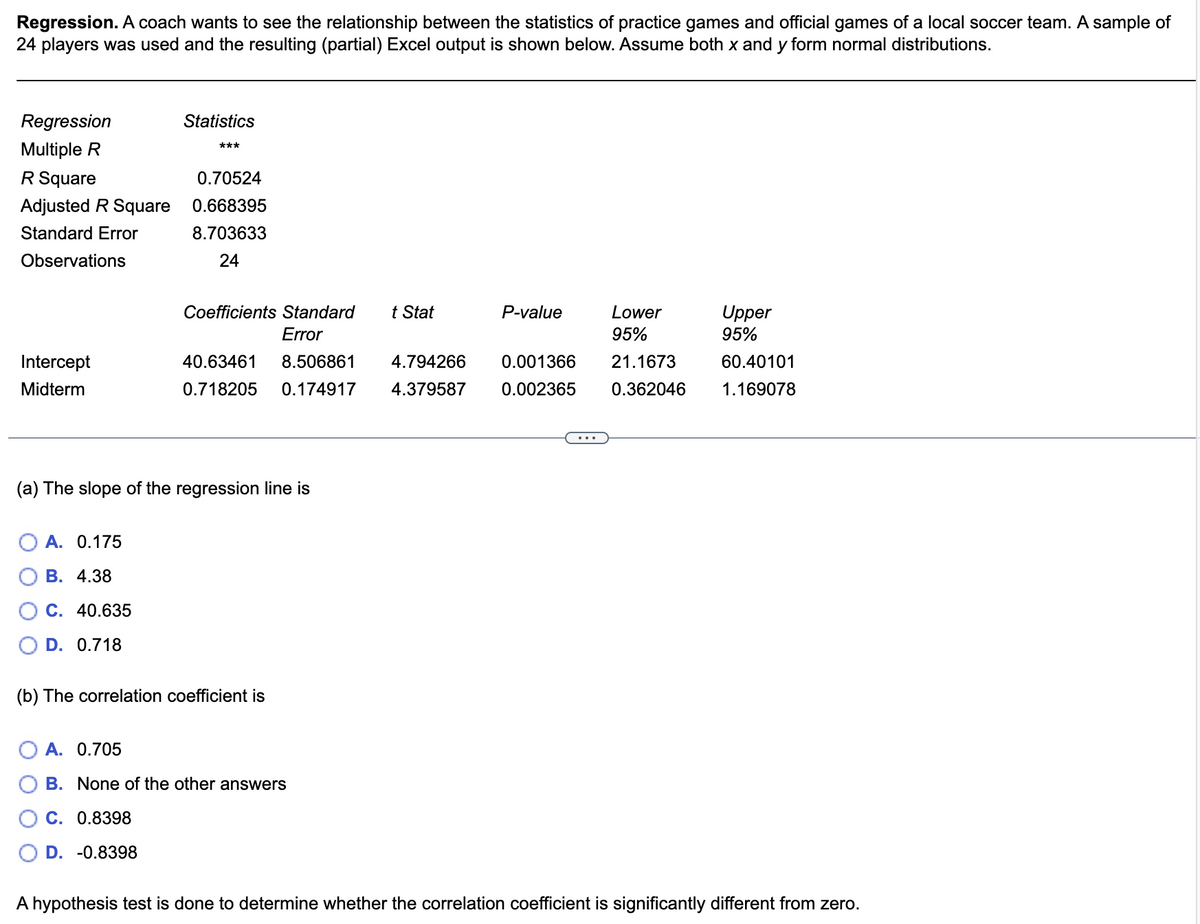
Transcribed Image Text:Regression. A coach wants to see the relationship between the statistics of practice games and official games of a local soccer team. A sample of
24 players was used and the resulting (partial) Excel output is shown below. Assume both x and y form normal distributions.
Regression
Statistics
Multiple R
***
R Square
0.70524
Adjusted R Square
0.668395
Standard Error
8.703633
Observations
24
Coefficients Standard
t Stat
P-value
Lower
Upper
95%
Error
95%
Intercept
40.63461
8.506861
4.794266
0.001366
21.1673
60.40101
Midterm
0.718205
0.174917
4.379587
0.002365
0.362046
1.169078
(a) The slope of the regression line is
A. 0.175
В. 4.38
C. 40.635
D. 0.718
(b) The correlation coefficient is
A. 0.705
B. None of the other answers
C. 0.8398
D. -0.8398
A hypothesis test is done to determine whether the correlation coefficient is significantly different from zero.
Expert Solution
This question has been solved!
Explore an expertly crafted, step-by-step solution for a thorough understanding of key concepts.

Step by step
Solved in 4 steps with 1 images

Recommended textbooks for you
MATLAB: An Introduction with Applications
Statistics
ISBN:
9781119256830
Author:
Amos Gilat
Publisher:
John Wiley & Sons Inc

Probability and Statistics for Engineering and th…
Statistics
ISBN:
9781305251809
Author:
Jay L. Devore
Publisher:
Cengage Learning

Statistics for The Behavioral Sciences (MindTap C…
Statistics
ISBN:
9781305504912
Author:
Frederick J Gravetter, Larry B. Wallnau
Publisher:
Cengage Learning
MATLAB: An Introduction with Applications
Statistics
ISBN:
9781119256830
Author:
Amos Gilat
Publisher:
John Wiley & Sons Inc
Probability and Statistics for Engineering and th…
Statistics
ISBN:
9781305251809
Author:
Jay L. Devore
Publisher:
Cengage Learning
Statistics for The Behavioral Sciences (MindTap C…
Statistics
ISBN:
9781305504912
Author:
Frederick J Gravetter, Larry B. Wallnau
Publisher:
Cengage Learning

Elementary Statistics: Picturing the World (7th E…
Statistics
ISBN:
9780134683416
Author:
Ron Larson, Betsy Farber
Publisher:
PEARSON

The Basic Practice of Statistics
Statistics
ISBN:
9781319042578
Author:
David S. Moore, William I. Notz, Michael A. Fligner
Publisher:
W. H. Freeman

Introduction to the Practice of Statistics
Statistics
ISBN:
9781319013387
Author:
David S. Moore, George P. McCabe, Bruce A. Craig
Publisher:
W. H. Freeman