THIRD OPTION - Create your OWN 1. What is the data value associated with az-score of 0.4? 2. What is the data value associated with -2.1? 3. What is the data value associated with -1.23? 4. What is the mean of this data set? 5. What is the standard deviation of this data set? 6. What is the variance of this data set? 7. What is the range of data values so that 90% of the data would be with the mean? 8. Are there any outliers with this data se? (Outliers refer to data points that lie beyond three standard deviation from the mean) 9. Why does not 100% of the data will always fall within three standard deviations of the mean? 10. What can you infer to the graph of your data (in general)?
THIRD OPTION - Create your OWN 1. What is the data value associated with az-score of 0.4? 2. What is the data value associated with -2.1? 3. What is the data value associated with -1.23? 4. What is the mean of this data set? 5. What is the standard deviation of this data set? 6. What is the variance of this data set? 7. What is the range of data values so that 90% of the data would be with the mean? 8. Are there any outliers with this data se? (Outliers refer to data points that lie beyond three standard deviation from the mean) 9. Why does not 100% of the data will always fall within three standard deviations of the mean? 10. What can you infer to the graph of your data (in general)?

MATLAB: An Introduction with Applications
6th Edition
ISBN:9781119256830
Author:Amos Gilat
Publisher:Amos Gilat
Chapter1: Starting With Matlab
Section: Chapter Questions
Problem 1P

Related questions
Question
Pls use the encircled column as the data. Answer 7 to 10
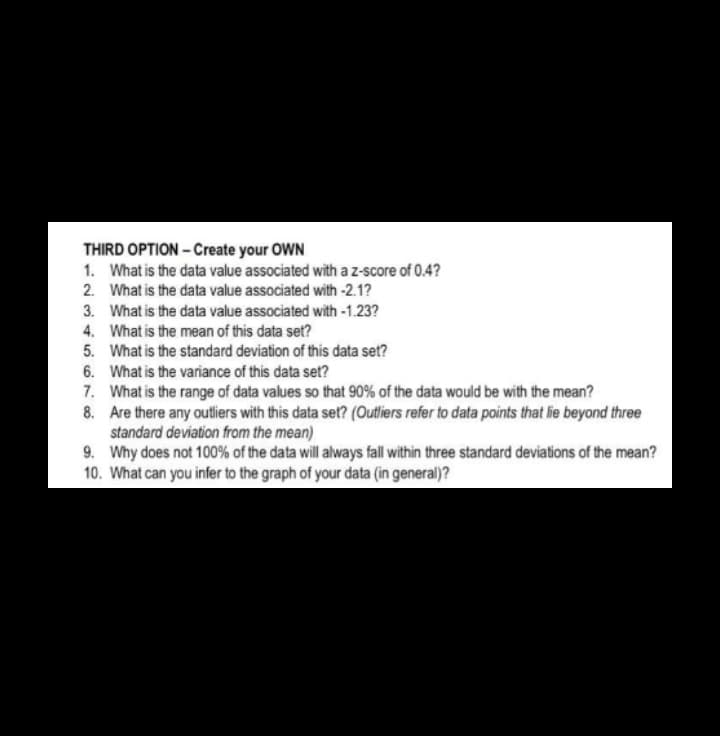
Transcribed Image Text:THIRD OPTION - Create your OWN
1. What is the data value associated with az-score of 0.4?
2. What is the data value associated with -2.1?
3. What is the data value associated with -1.23?
4. What is the mean of this data set?
5. What is the standard deviation of this data set?
6. What is the variance of this data set?
7. What is the range of data values so that 90% of the data would be with the mean?
8. Are there any outliers with this data set? (Outliers refer to data points that lie beyond three
standard deviation from the mean)
9. Why does not 100% of the data will always fall within three standard deviations of the mean?
10. What can you infer to the graph of your data (in general)?
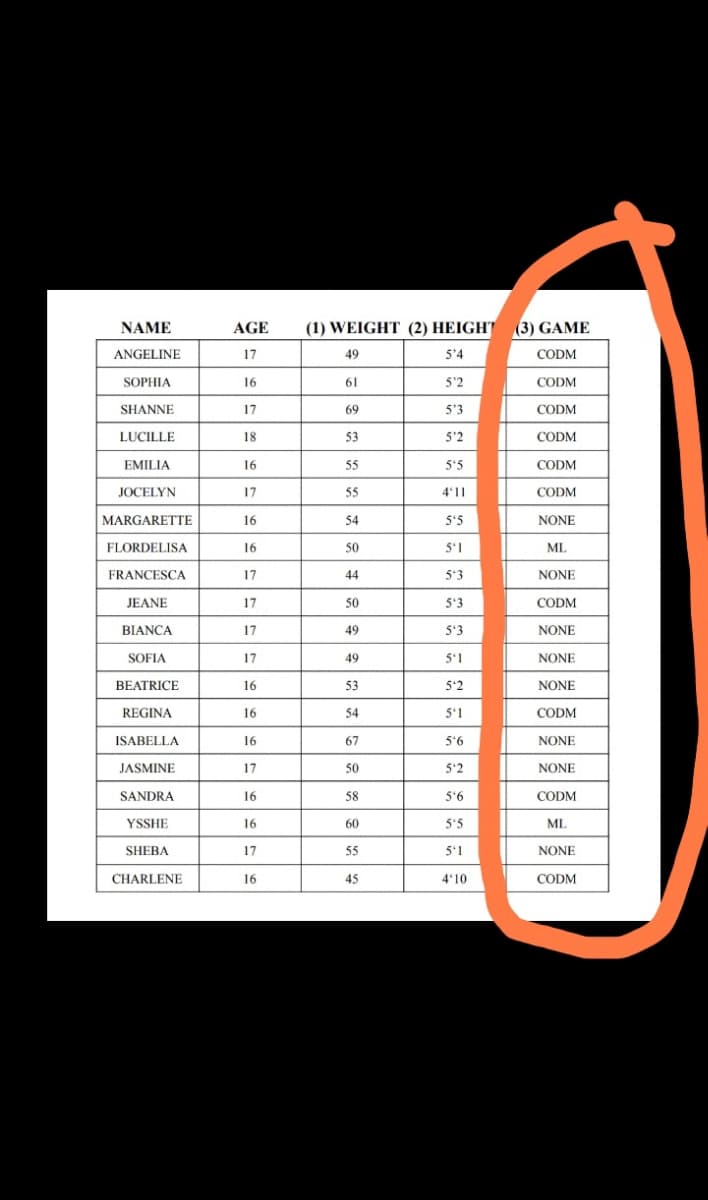
Transcribed Image Text:NAME
AGE
(1) WEIGHT (2) HEIGHT (3) GAME
ANGELINE
17
49
5'4
CODM
SOPHIA
16
61
5'2
CODM
SHANNE
17
69
5'3
CODM
LUCILLE
18
53
5'2
CODM
EMILIA
16
55
5'5
CODM
JOCELYN
17
55
4'11
CODM
MARGARETTE
16
54
5'5
NONE
FLORDELISA
16
50
5'1
ML
FRANCESCA
17
44
5'3
NONE
JEANE
17
50
5'3
CODM
BIANCA
17
49
5'3
NONE
SOFIA
17
49
5'1
NONE
BEATRICE
16
53
5'2
NONE
REGINA
16
54
5'1
CODM
ISABELLA
16
67
5*6
NONE
JASMINE
17
50
5'2
NONE
SANDRA
16
58
5'6
CODM
YSSHE
16
60
5'5
ML
SHEBA
17
55
5'1
NONE
CHARLENE
16
45
4'10
CODM
Expert Solution
This question has been solved!
Explore an expertly crafted, step-by-step solution for a thorough understanding of key concepts.

This is a popular solution!

Trending now
This is a popular solution!

Step by step
Solved in 3 steps

Recommended textbooks for you
MATLAB: An Introduction with Applications
Statistics
ISBN:
9781119256830
Author:
Amos Gilat
Publisher:
John Wiley & Sons Inc

Probability and Statistics for Engineering and th…
Statistics
ISBN:
9781305251809
Author:
Jay L. Devore
Publisher:
Cengage Learning

Statistics for The Behavioral Sciences (MindTap C…
Statistics
ISBN:
9781305504912
Author:
Frederick J Gravetter, Larry B. Wallnau
Publisher:
Cengage Learning
MATLAB: An Introduction with Applications
Statistics
ISBN:
9781119256830
Author:
Amos Gilat
Publisher:
John Wiley & Sons Inc
Probability and Statistics for Engineering and th…
Statistics
ISBN:
9781305251809
Author:
Jay L. Devore
Publisher:
Cengage Learning
Statistics for The Behavioral Sciences (MindTap C…
Statistics
ISBN:
9781305504912
Author:
Frederick J Gravetter, Larry B. Wallnau
Publisher:
Cengage Learning

Elementary Statistics: Picturing the World (7th E…
Statistics
ISBN:
9780134683416
Author:
Ron Larson, Betsy Farber
Publisher:
PEARSON

The Basic Practice of Statistics
Statistics
ISBN:
9781319042578
Author:
David S. Moore, William I. Notz, Michael A. Fligner
Publisher:
W. H. Freeman

Introduction to the Practice of Statistics
Statistics
ISBN:
9781319013387
Author:
David S. Moore, George P. McCabe, Bruce A. Craig
Publisher:
W. H. Freeman