
MATLAB: An Introduction with Applications
6th Edition
ISBN: 9781119256830
Author: Amos Gilat
Publisher: John Wiley & Sons Inc
expand_more
expand_more
format_list_bulleted
Concept explainers
Topic Video
Question

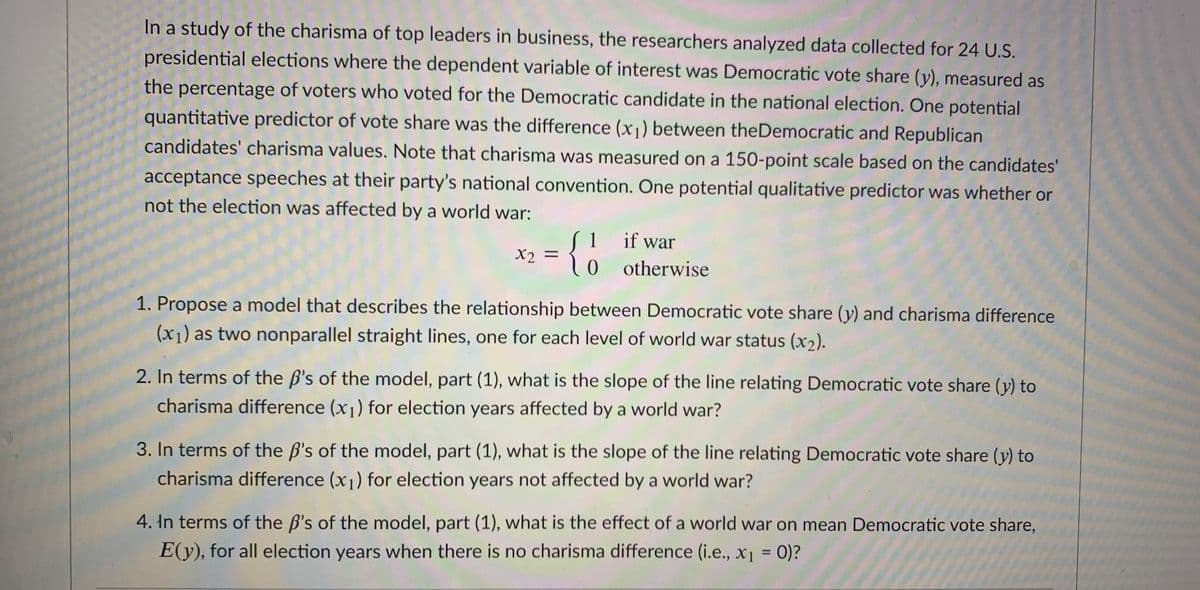
Transcribed Image Text:In a study of the charisma of top leaders in business, the researchers analyzed data collected for 24 U.S.
presidential elections where the dependent variable of interest was Democratic vote share (y), measured as
the percentage of voters who voted for the Democratic candidate in the national election. One potential
quantitative predictor of vote share was the difference (x1) between theDemocratic and Republican
candidates' charisma values. Note that charisma was measured on a 150-point scale based on the candidates'
acceptance speeches at their party's national convention. One potential qualitative predictor was whether or
not the election was affected by a world war:
1
X2 =
if war
otherwise
1. Propose a model that describes the relationship between Democratic vote share (y) and charisma difference
(x1) as two nonparallel straight lines, one for each level of world war status (x2).
2. In terms of the B's of the model, part (1), what is the slope of the line relating Democratic vote share (y) to
charisma difference (x1) for election years affected by a world war?
3. In terms of the B's of the model, part (1), what is the slope of the line relating Democratic vote share (y) to
charisma difference (x1) for election years not affected by a world war?
4. In terms of the B's of the model, part (1), what is the effect of a world war on mean Democratic vote share,
E(y), for all election years when there is no charisma difference (i.e., x1 = 0)?
%3D
Expert Solution

This question has been solved!
Explore an expertly crafted, step-by-step solution for a thorough understanding of key concepts.
This is a popular solution
Trending nowThis is a popular solution!
Step by stepSolved in 5 steps with 5 images

Knowledge Booster
Learn more about
Need a deep-dive on the concept behind this application? Look no further. Learn more about this topic, statistics and related others by exploring similar questions and additional content below.Similar questions
- We take another look at the confidence in the executive branch of the federal government (CONFED) is presented with two independent variables---(1) respondent race and (2) age (measured in categories as reported in corresponding tables). Interpret each measure of association. Which variable---race or age---has a higher proportional reduction of error?arrow_forwardIn a quantitative analysis where widowed people suffering with bereavement suffer with a poor quality of life. Would Widowed Individuals be the Unit of Analysis? The quality of life be the dependent variable, therefore making bereavement the independent variable?arrow_forwardOne study found a positive correlation between years of education and yearly income. Which fact would lead you to believe that the relationship between years of education and yearly income is one of causation and not correlation?arrow_forward
- A research study was conducted about gender differences in Sexting. The researcher believe that the proportion of girls involved in sexting is less than the proportion of boys involved. The data collected in the spring of 2010 among a random sample of middle and high school students in a large school district in the southern United States is summarized in table. Is the proportion of girls sending sexts less than the proportion of boys sexting? The test at 1% level of significance. Females Males Sent sexts x1= 156 x2= 183 Total number surveyed n1= 2169 n2= 2231 Let M and F Be the subscripts for males and females. Then pM and pF are the desired population proportions. What is the question/claim to be tested in symbols the hypothesis is Ho: Ha: which hypothesis matches the claim test objective is to reject or support level of significance a=.01 type of test (left, right, two-tailed) the applicable test to be applied is (2-sampZTEST/2-sampTTEST, 2-propZTEST)…arrow_forwardThe US Department of Housing and Urban Development continues to try to reduce crime rates in public housing projects. Data are available for many variables, including age, income, unemployment, etc. What test could be used to determine whether any of these factors are associated with crime rates?arrow_forward6. Assume that the scatterplot shows the median volume and median value of used cars over the years in the UK used car market. (a) As the data are graphed, which is the independent and which is the dependent variable? (b) Why do you suppose median value and volume have been used instead of the mean? (c) Using the graph, estimate the median value of sales if the median volume of used cars sold is 2.3 million. (d) Use the equation to predict the median value of sales if the median volume of used cars sold is 2.3 million. (e) What other factors besides the price of used cars might influence the volume of used cars sold? Value = 30.97 – 1.211 Volume 40 35 30 25 20 - 15 10 - 0+ 1.5 2 2.5 Median Volume of Used Cars Sold (in millions) Median Value of Used Car Sales (in billions of pounds)arrow_forward
- A research study was conducted at a local college collecting data on the models (brands) of cars parked in the student parking lot. This type of data collected would be considered/described as Qualitative Data or Quantitative Data?arrow_forwardSuppose you were to collect data for the following pair of variables, drivers: blood alcohol level, reaction time. You want to make a scatter plot. Which variable would you use as the explanatory variable? Blood alcohol or reaction time? Which variable would you use as the response variable? Blood alcohol or reaction time? Would you expect to see a positive or negative association? Or neither?arrow_forwardBy a small margin, Facebook remains the top choice of social media over all ages, with 29% using Facebook most often among those using social media sites. However, more visually oriented social networks such as Snapchat and Instagram continue to draw in younger audiences. When asked "Which one social networking brand do you use most often?" the results in the table show the top brands chosen by Americans aged 12-34 who currently use any social networking site or service. Social M edia Site Faceboo k Snapchat Instagra m Twitter Percentage That Use Most Often 29 28 26 6 20 (a) What is the sum of the percentages for these top social media sites? Give your answer as an exact number. Macmillan Learning top social media sites: What percent of Americans aged 12-34 use other social media sites most often? Give your answer as an exact number. other social media sites: do %arrow_forward
- A study was undertaken to see how accurate food labeling for calories on food that is considered reduced calorie. The group measured the amount of calories for each item of food and then found the percent difference between the measured and labeled amount of calories. The group also looked at food that was nationally advertised, regionally distributed, or locally prepared. Do the data indicate that at least one of the mean percent differences between the three groups is different from the others? The data is summarized in the table below. National Mean Standard Deviation Sample Size Local -2.1 Regional 27.1667 143.125 Fill in the hypotheses below: Ho: Select an answer Ha: Select an answer 10.3257 20.797 53.5922 20 12 8arrow_forwardIn a study of the effects of the drug THC on driving performance, driving performance would be the Independent variable. a. true b. falsearrow_forwardThe EPA records data on the fuel economy of many different makes of cars. They are interested in determining if one could predict the mileage of the car (in miles per gallon) from the weight of the car (in pounds). What is the response variable to this study?arrow_forward
arrow_back_ios
SEE MORE QUESTIONS
arrow_forward_ios
Recommended textbooks for you
- MATLAB: An Introduction with ApplicationsStatisticsISBN:9781119256830Author:Amos GilatPublisher:John Wiley & Sons IncProbability and Statistics for Engineering and th...StatisticsISBN:9781305251809Author:Jay L. DevorePublisher:Cengage LearningStatistics for The Behavioral Sciences (MindTap C...StatisticsISBN:9781305504912Author:Frederick J Gravetter, Larry B. WallnauPublisher:Cengage Learning
- Elementary Statistics: Picturing the World (7th E...StatisticsISBN:9780134683416Author:Ron Larson, Betsy FarberPublisher:PEARSONThe Basic Practice of StatisticsStatisticsISBN:9781319042578Author:David S. Moore, William I. Notz, Michael A. FlignerPublisher:W. H. FreemanIntroduction to the Practice of StatisticsStatisticsISBN:9781319013387Author:David S. Moore, George P. McCabe, Bruce A. CraigPublisher:W. H. Freeman

MATLAB: An Introduction with Applications
Statistics
ISBN:9781119256830
Author:Amos Gilat
Publisher:John Wiley & Sons Inc

Probability and Statistics for Engineering and th...
Statistics
ISBN:9781305251809
Author:Jay L. Devore
Publisher:Cengage Learning

Statistics for The Behavioral Sciences (MindTap C...
Statistics
ISBN:9781305504912
Author:Frederick J Gravetter, Larry B. Wallnau
Publisher:Cengage Learning

Elementary Statistics: Picturing the World (7th E...
Statistics
ISBN:9780134683416
Author:Ron Larson, Betsy Farber
Publisher:PEARSON

The Basic Practice of Statistics
Statistics
ISBN:9781319042578
Author:David S. Moore, William I. Notz, Michael A. Fligner
Publisher:W. H. Freeman

Introduction to the Practice of Statistics
Statistics
ISBN:9781319013387
Author:David S. Moore, George P. McCabe, Bruce A. Craig
Publisher:W. H. Freeman