The Wall Street Journal asked Concur Technologies, Inc., an expense management company, to examine data from 8.3 million expense reports to provide insights regarding business travel expenses. Their analysis of the data showed that New York was the most expensive city. The following table shows the average daily hotel room rate (x) and the average amount spent on entertainment (y) for a random sample of 9 of the 25 most-visited U.S. cities. These lead to the estimated regression equation ŷ = 17.49 + 1.0334x. For these data SSE = 1541.4. Click on the datafile logo to reference the data. Use Tabl Appendix B. DATA File Room Rate Entertainment City ($) ($) Boston 148 161 Denver 96 105 Nashville 91 101 New Orleans 110 142 Phoenix 90 100 San Diego 102 120 San Francisco 136 167 San Jose 90 140 Tampa 82 98 a. Predict the amount spent on entertainment for a particular city that has a daily room rate of $89 (to 2 decimals). b. Develop a 95% confidence interval for the mean amount spent on entertainment for all cities that have a daily room rate of $89 (to 2 decimals). to $ c. The average room rate in Chicago is $128. Develop a 95% prediction interval for the amount spent on entertainment in Chicago (to 2 decimals). to $
The Wall Street Journal asked Concur Technologies, Inc., an expense management company, to examine data from 8.3 million expense reports to provide insights regarding business travel expenses. Their analysis of the data showed that New York was the most expensive city. The following table shows the average daily hotel room rate (x) and the average amount spent on entertainment (y) for a random sample of 9 of the 25 most-visited U.S. cities. These lead to the estimated regression equation ŷ = 17.49 + 1.0334x. For these data SSE = 1541.4. Click on the datafile logo to reference the data. Use Tabl Appendix B. DATA File Room Rate Entertainment City ($) ($) Boston 148 161 Denver 96 105 Nashville 91 101 New Orleans 110 142 Phoenix 90 100 San Diego 102 120 San Francisco 136 167 San Jose 90 140 Tampa 82 98 a. Predict the amount spent on entertainment for a particular city that has a daily room rate of $89 (to 2 decimals). b. Develop a 95% confidence interval for the mean amount spent on entertainment for all cities that have a daily room rate of $89 (to 2 decimals). to $ c. The average room rate in Chicago is $128. Develop a 95% prediction interval for the amount spent on entertainment in Chicago (to 2 decimals). to $

Glencoe Algebra 1, Student Edition, 9780079039897, 0079039898, 2018
18th Edition
ISBN:9780079039897
Author:Carter
Publisher:Carter
Chapter10: Statistics
Section10.6: Summarizing Categorical Data
Problem 23PPS

Related questions
Question
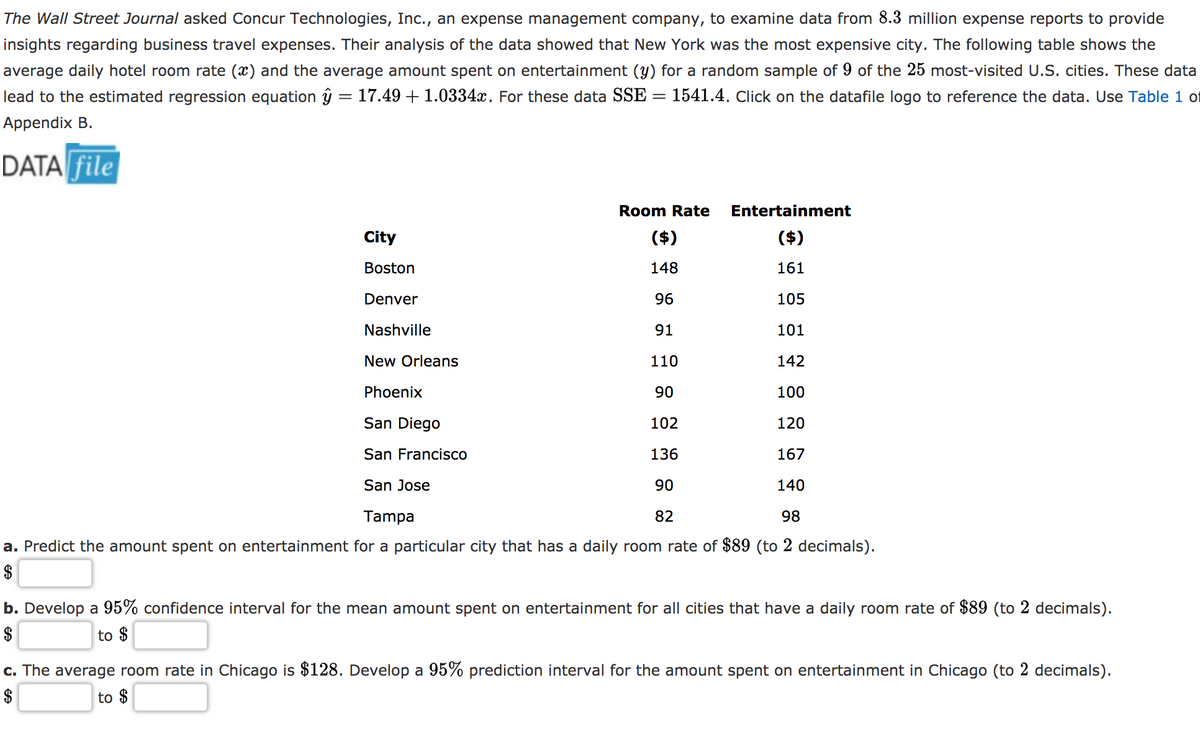
Transcribed Image Text:The Wall Street Journal asked Concur Technologies, Inc., an expense management company, to examine data from 8.3 million expense reports to provide
insights regarding business travel expenses. Their analysis of the data showed that New York was the most expensive city. The following table shows the
average daily hotel room rate (x) and the average amount spent on entertainment (y) for a random sample of 9 of the 25 most-visited U.S. cities. These data
lead to the estimated regression equation ŷ = 17.49 +1.0334x. For these data SSE = 1541.4. Click on the datafile logo to reference the data. Use Table 1 of
Appendix B.
DATA file
Room Rate
Entertainment
City
($)
($)
Boston
148
161
Denver
96
105
Nashville
91
101
New Orleans
110
142
Phoenix
90
100
San Diego
102
120
San Francisco
136
167
San Jose
90
140
Tampa
82
98
a. Predict the amount spent on entertainment for a particular city that has a daily room rate of $89 (to 2 decimals).
$
b. Develop a 95% confidence interval for the mean amount spent on entertainment for all cities that have a daily room rate of $89 (to 2 decimals).
$
to $
c. The average room rate in Chicago is $128. Develop a 95% prediction interval for the amount spent on entertainment in Chicago (to 2 decimals).
to $
%24
Expert Solution
This question has been solved!
Explore an expertly crafted, step-by-step solution for a thorough understanding of key concepts.

This is a popular solution!

Trending now
This is a popular solution!

Step by step
Solved in 3 steps

Knowledge Booster


Learn more about
Need a deep-dive on the concept behind this application? Look no further. Learn more about this topic, statistics and related others by exploring similar questions and additional content below.Recommended textbooks for you
Glencoe Algebra 1, Student Edition, 9780079039897…
Algebra
ISBN:
9780079039897
Author:
Carter
Publisher:
McGraw Hill

Big Ideas Math A Bridge To Success Algebra 1: Stu…
Algebra
ISBN:
9781680331141
Author:
HOUGHTON MIFFLIN HARCOURT
Publisher:
Houghton Mifflin Harcourt
Glencoe Algebra 1, Student Edition, 9780079039897…
Algebra
ISBN:
9780079039897
Author:
Carter
Publisher:
McGraw Hill
Big Ideas Math A Bridge To Success Algebra 1: Stu…
Algebra
ISBN:
9781680331141
Author:
HOUGHTON MIFFLIN HARCOURT
Publisher:
Houghton Mifflin Harcourt