In a survey from a certain year, the range of annual salaries reported was from $73,187 to $336,550. But do CEO salaries differ across the two most populous states in the United States? Consider the salaries from that year for CEOS who work for companies headquartered in California and Texas as provided in the following table. CEO Salaries (in $1,000s) California Texas $322 $92 $120 $213 $137 $160 $181 $245 $314 $200 $262 $302 $124 $185 $131 $206 $274 $87 $307 $176 $224 $209 $195 $105 Use a 0.05 and test to determine whether the distribution of CEO salaries is the same for California and Texas. What is your conclusion? State the null and alternative hypotheses. OH: Median for California CEO salaries - Median for Texas CEO salaries 20 H: Median for California CEO salaries - Median for Texas CEO salaries < 0 H₁: Median for California CEO salaries - Median for Texas CEO salaries O H: Median for California CEO salaries - Median for Texas CEO salaries > 0 H₂: The two populations of CEO salaries are identical. H: The two populations of CEO salaries are not identical. Ho! Median for California CEO salaries - Median for Texas CEO salaries > 0 H: Median for California CEO salaries - Median for Texas CEO salaries - 0 OH: The two populations of CEO salaries are not identical. H: The two populations of CEO salaries are identical. Find the value of the test statistic. W-
In a survey from a certain year, the range of annual salaries reported was from $73,187 to $336,550. But do CEO salaries differ across the two most populous states in the United States? Consider the salaries from that year for CEOS who work for companies headquartered in California and Texas as provided in the following table. CEO Salaries (in $1,000s) California Texas $322 $92 $120 $213 $137 $160 $181 $245 $314 $200 $262 $302 $124 $185 $131 $206 $274 $87 $307 $176 $224 $209 $195 $105 Use a 0.05 and test to determine whether the distribution of CEO salaries is the same for California and Texas. What is your conclusion? State the null and alternative hypotheses. OH: Median for California CEO salaries - Median for Texas CEO salaries 20 H: Median for California CEO salaries - Median for Texas CEO salaries < 0 H₁: Median for California CEO salaries - Median for Texas CEO salaries O H: Median for California CEO salaries - Median for Texas CEO salaries > 0 H₂: The two populations of CEO salaries are identical. H: The two populations of CEO salaries are not identical. Ho! Median for California CEO salaries - Median for Texas CEO salaries > 0 H: Median for California CEO salaries - Median for Texas CEO salaries - 0 OH: The two populations of CEO salaries are not identical. H: The two populations of CEO salaries are identical. Find the value of the test statistic. W-

MATLAB: An Introduction with Applications
6th Edition
ISBN:9781119256830
Author:Amos Gilat
Publisher:Amos Gilat
Chapter1: Starting With Matlab
Section: Chapter Questions
Problem 1P

Related questions
Question
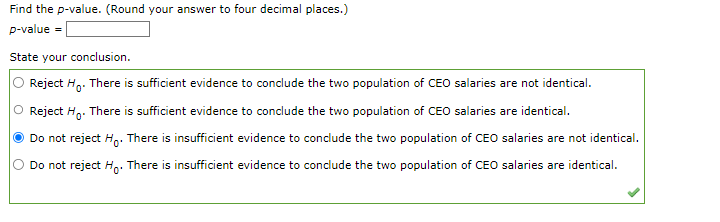
Transcribed Image Text:Find the p-value. (Round your answer to four decimal places.)
p-value =
State your conclusion.
Reject Ho. There is sufficient evidence to conclude the two population of CEO salaries are not identical.
O Reject Ho. There is sufficient evidence to conclude the two population of CEO salaries are identical.
Do not reject Ho. There is insufficient evidence to conclude the two population of CEO salaries are not identical.
Do not reject Ho. There is insufficient evidence to conclude the two population of CEO salaries are identical.
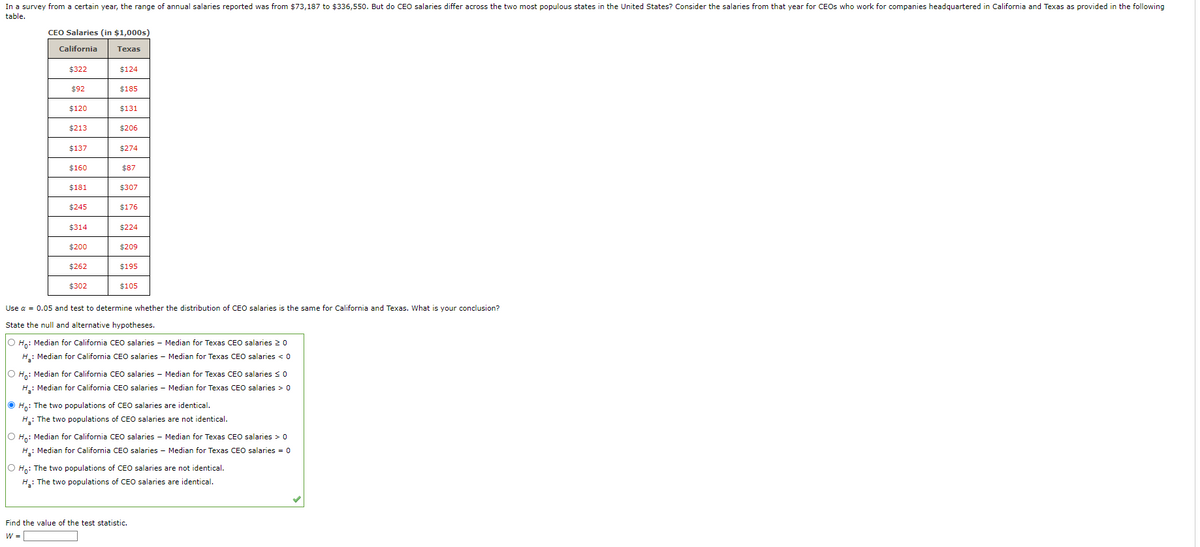
Transcribed Image Text:In a survey from a certain year, the range of annual salaries reported was from $73,187 to $336,550. But do CEO salaries differ across the two most populous states in the United States? Consider the salaries from that year for CEOs who work for companies headquartered in California and Texas as provided in the following
table.
CEO Salaries (in $1,000s)
California
Texas
$322
$92
$120
$213
$137
$160
$181
$245
$314
$200
$262
$302
$124
$185
$131
$206
$274
$87
$307
$176
$224
$209
$195
$105
Use α = 0.05 and test to determine whether the distribution of CEO salaries is the same for California and Texas. What is your conclusion?
State the null and alternative hypotheses.
O Ho: Median for California CEO salaries - Median for Texas CEO salaries 20
H₂: Median for California CEO salaries - Median for Texas CEO salaries < 0
O Ho: Median for California CEO salaries - Median for Texas CEO salaries ≤ 0
H₂: Median for California CEO salaries - Median for Texas CEO salaries > 0
ⒸH: The two populations of CEO salaries are identical.
H₂: The two populations of CEO salaries are not identical.
O Ho: Median for California CEO salaries - Median for Texas CEO salaries > 0
H₂: Median for California CEO salaries - Median for Texas CEO salaries = 0
O Ho: The two populations of CEO salaries are not identical.
H₂: The two populations of CEO salaries are identical.
Find the value of the test statistic.
W =
Expert Solution
This question has been solved!
Explore an expertly crafted, step-by-step solution for a thorough understanding of key concepts.

Step by step
Solved in 7 steps with 1 images

Recommended textbooks for you
MATLAB: An Introduction with Applications
Statistics
ISBN:
9781119256830
Author:
Amos Gilat
Publisher:
John Wiley & Sons Inc

Probability and Statistics for Engineering and th…
Statistics
ISBN:
9781305251809
Author:
Jay L. Devore
Publisher:
Cengage Learning

Statistics for The Behavioral Sciences (MindTap C…
Statistics
ISBN:
9781305504912
Author:
Frederick J Gravetter, Larry B. Wallnau
Publisher:
Cengage Learning
MATLAB: An Introduction with Applications
Statistics
ISBN:
9781119256830
Author:
Amos Gilat
Publisher:
John Wiley & Sons Inc
Probability and Statistics for Engineering and th…
Statistics
ISBN:
9781305251809
Author:
Jay L. Devore
Publisher:
Cengage Learning
Statistics for The Behavioral Sciences (MindTap C…
Statistics
ISBN:
9781305504912
Author:
Frederick J Gravetter, Larry B. Wallnau
Publisher:
Cengage Learning

Elementary Statistics: Picturing the World (7th E…
Statistics
ISBN:
9780134683416
Author:
Ron Larson, Betsy Farber
Publisher:
PEARSON

The Basic Practice of Statistics
Statistics
ISBN:
9781319042578
Author:
David S. Moore, William I. Notz, Michael A. Fligner
Publisher:
W. H. Freeman

Introduction to the Practice of Statistics
Statistics
ISBN:
9781319013387
Author:
David S. Moore, George P. McCabe, Bruce A. Craig
Publisher:
W. H. Freeman