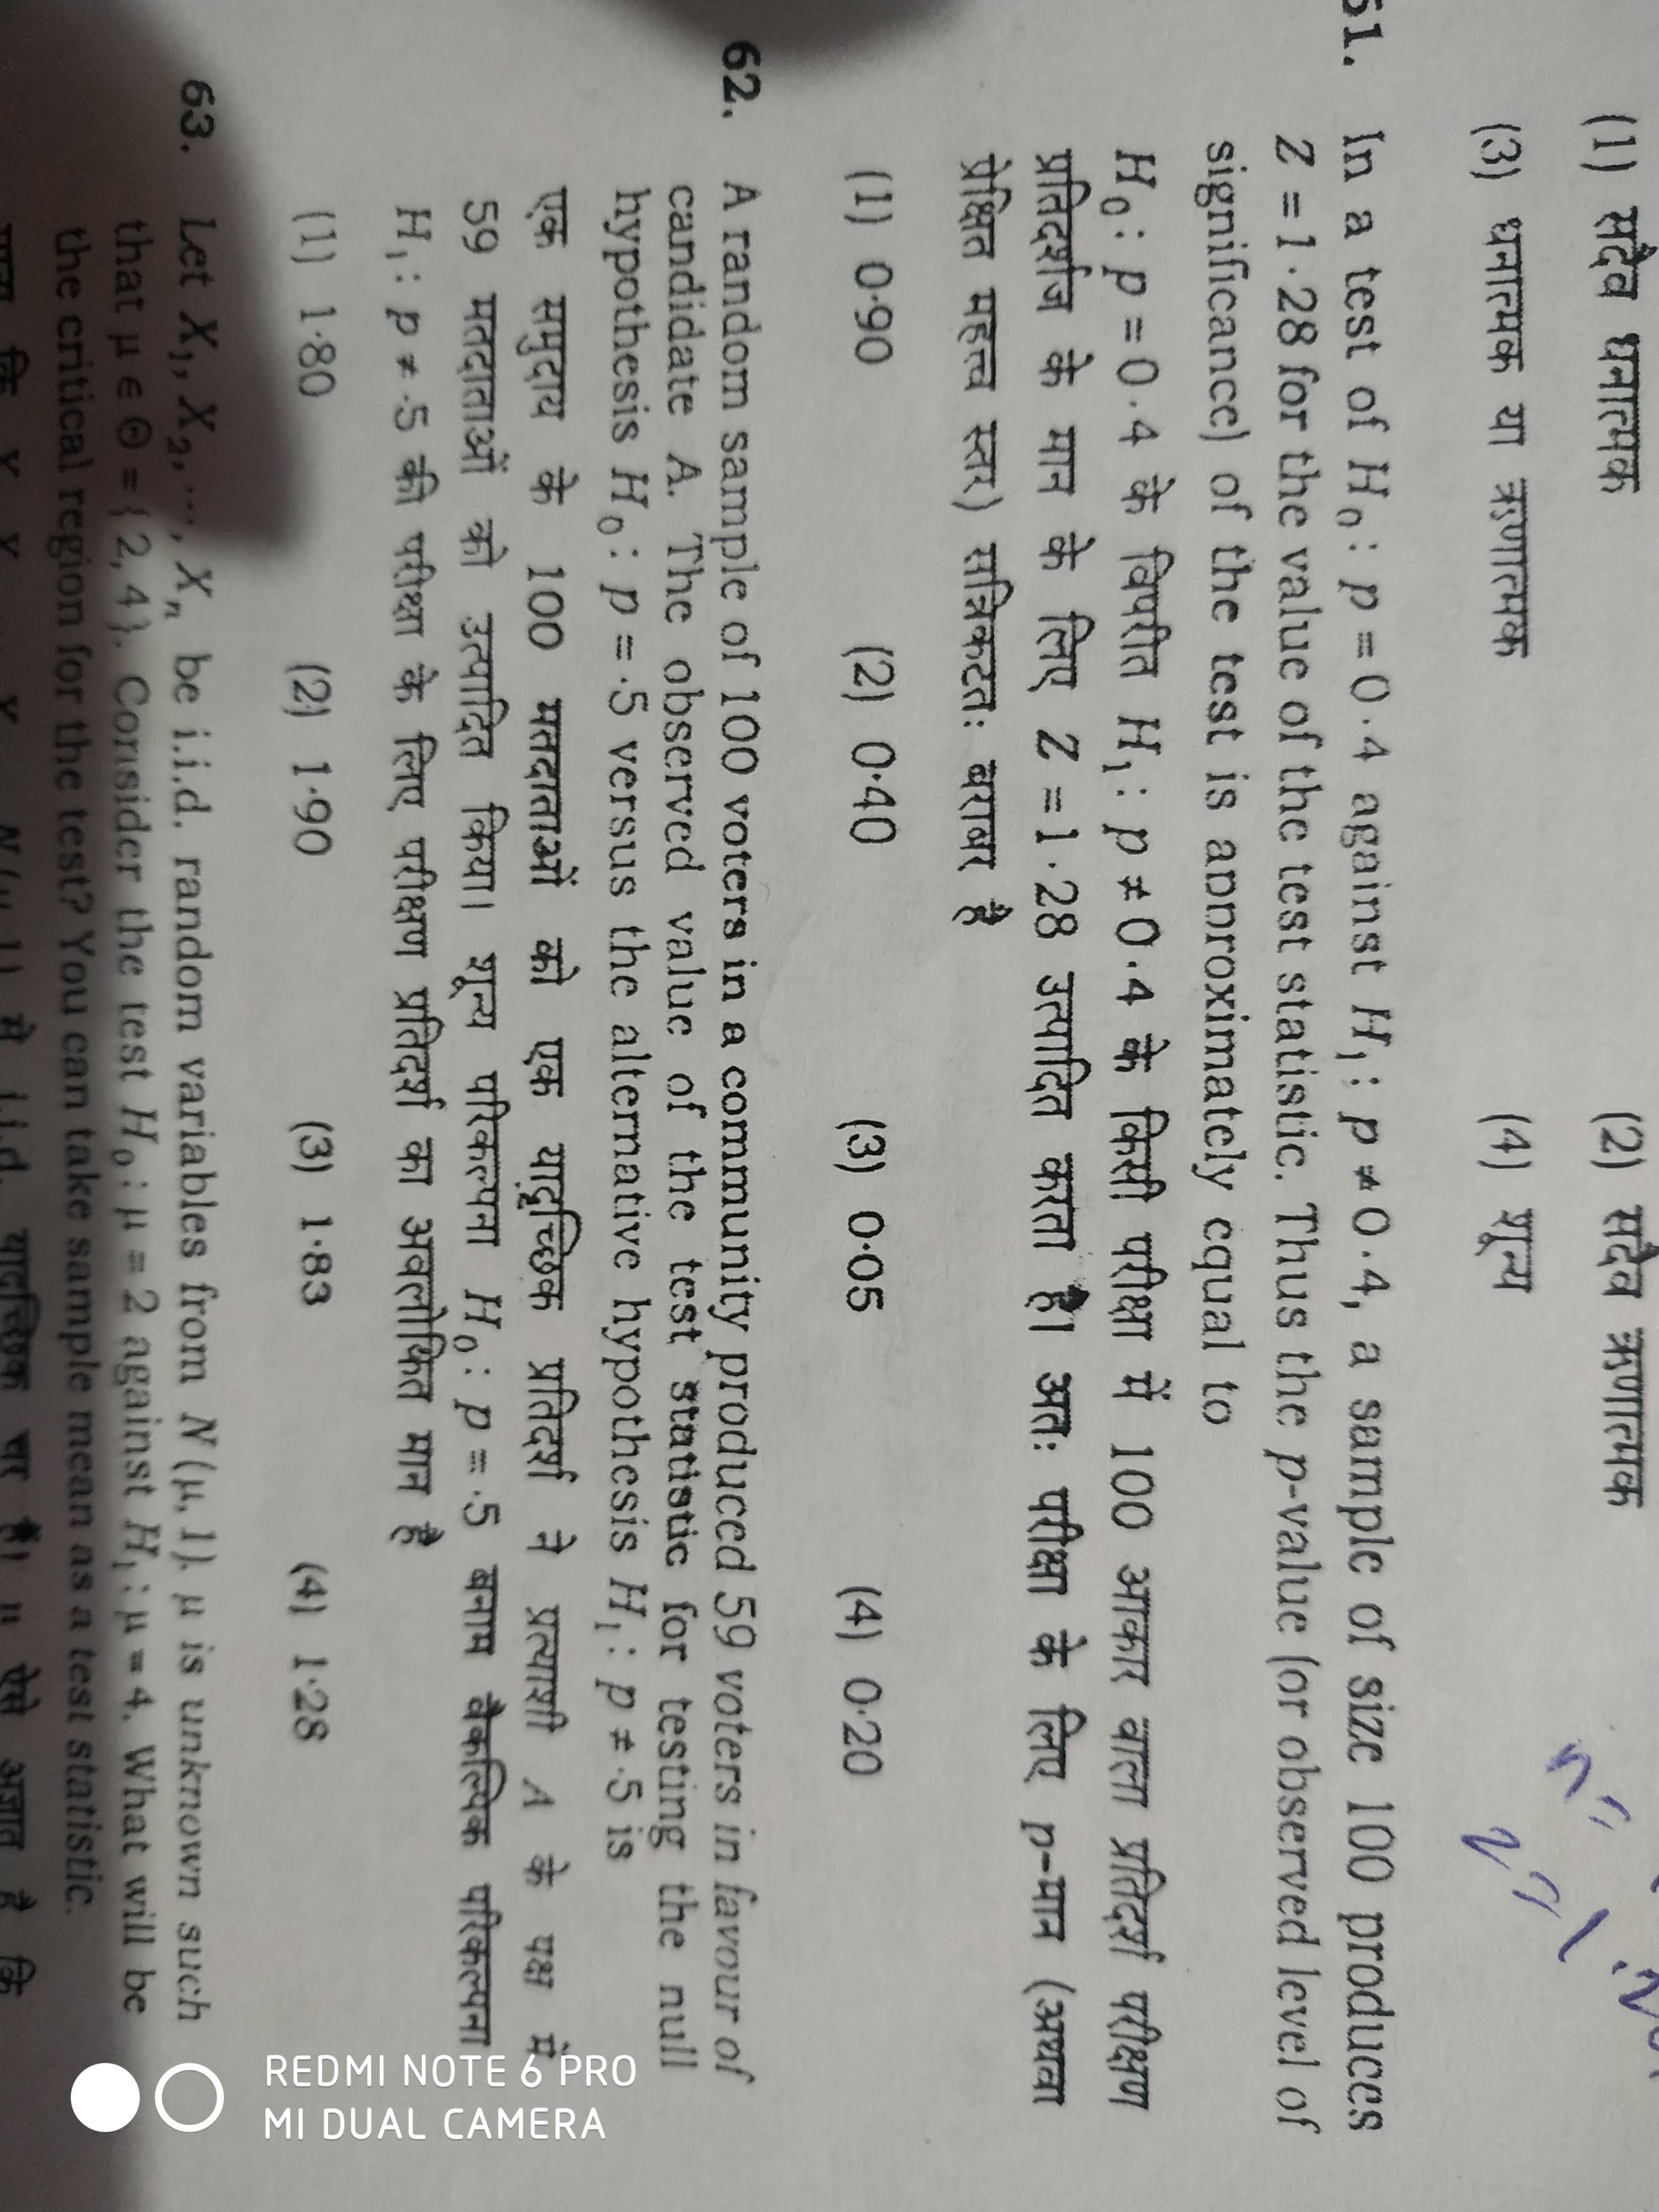
In a test of Ho:p=0.4 against H: p 0.4, a sample of sizc 100 produces Z 31•28 for the value of the test statistic. Thus the p-value (or observed level of significance) of the test is apnroximately cqual to %3D %3D H, : p = 0 -4 के विपरीत H, : p + 0.4 के किसी परीक्षा में 100 आकार वाला प्रतिदर्श परीक्षण प्रतिदर्शज के मान के लिए 2 = 1 .28 उत्पादित करता है। अतः परीक्षा के लिए p-मान (अथवा प्रेक्षित महत्त्व स्तर) सत्निकटतः बराबर है %3D (1) 0-90 (2) 0:40 (3) 0-05 (4) 0-20
Q: For 50 randomly selected speed dates, attractiveness ratings by males of their female date partners…
A:
Q: A researcher obtained a result of t(9)=1.22, p>.05 for their study using a one sample t-test. Are…
A: It is given that p > 0.05 and t-critical value = 1.22.
Q: The test statistic of z = −1.79 is obtained when testing the claim that p = 1/4. Using a…
A: the critical value = 2.58 since |1.79| < 2.58, we fail to reject H0
Q: For 50 randomly selected speed dates, attractiveness ratings by males of their female date partners…
A:
Q: For 50 randomly selected speed dates, attractiveness ratings by males of their female date partners…
A: Let the independent variable X denote the attractiveness ratings by males of their female data…
Q: For 50 randomly selected speed dates, attractiveness ratings by males of their female date partners…
A: Solution: From the given information, the regression equation is
Q: For 50 randomly selected speed dates, attractiveness ratings by males of their female date…
A: Given, The 50 paired ratings yield x=6.3, y=6.0, r=−0.264, P-value=0.063, and y=7.92−0.304x.
Q: For 50 randomly selected speed dates, attractiveness ratings by males of their female date…
A: Decision Rule : Reject H0 if P-value < ? . Here P-value = 0.326 > 0.10. Conclusion : By…
Q: For 50 randomly selected speed dates, attractiveness ratings by males of their female date partners…
A: Given Regression Equation is:
Q: For 50 randomly selected speed dates, attractiveness ratings by males of their female date partners…
A: The given regression equation is ŷ =7.82-0.283x
Q: For 50 randomly selected speed dates, attractiveness ratings by males of their female date partners…
A: Given, The linear regression line is, The objective is to find the best predicted value of y^…
Q: For 50 randomly selected speed dates, attractiveness ratings by males of their female date partners…
A: Given, The linear regression line is, The objective is to find the best predicted value of…
Q: For 50 randomly selected speed dates, attractiveness ratings by males of their female date partners…
A:
Q: For 50 randomly selected speed dates, attractiveness ratings by males of their female date partners…
A:
Q: For 50 randomly selected speed dates, attractiveness ratings by males of their female date partners…
A: Given, y^=7.53 - 0.243x
Q: For 50 randomly selected speed dates, attractiveness ratings by males of their female date…
A: Decision Rule for hypothesis testing : During a statistical test, the p- value helps us determine…
Q: For 50 randomly selected speed dates, attractiveness ratings by males of their female date partners…
A: Given, The best fit line is, The objective is to find the best predicted value of y^ when x =…
Q: An article in the ASCE Journal of Energy Engineering (1999, Vol. 125, pp. 59-75) describes a study…
A: Given information- Population mean, μ = 22.5 Sample size, n = 5 I have used following functions for…
Q: For 50 randomly selected speed dates, attractiveness ratings by males of their female date…
A: Decision Rule for hypothesis testing : During a statistical test, the p- value helps us determine…
Q: The test statistic of z=−1.69 is obtained when testing the claim that p=1/2. a. Using a significance…
A: Solution: a. State the hypotheses. Null hypothesis: H0: p=1/2 Alternative hypothesis: H1: p≠1/2
Q: Because npo (1- po) = 288.8 > 10 and the sample size is less than 5% of the population size, and the…
A: Because and the sample size is less than 5% of the population size and the sample can be…
Q: The test statistic of z=−1.68 is obtained when testing the claim that p<0.88. a. Using a…
A:
Q: test statistics of z = 3.15 is obtained when testing the claim that p > 0.27. Use the significance…
A:
Q: The test statistic of z = - 2.39 is obtained when testing the claim that p<0.12. a. Using a…
A: The given information is that the value of test statistic is –2.39 and the claim of the test is p…
Q: For 50 randomly selected speed dates, attractiveness ratings by males of their female date partners…
A: Solution
Q: For 50 randomly selected speed dates, attractiveness ratings by males of their female date partners…
A: We have given that xbar =6.3. ybar=5.9, r=-0.269, P-value = 0.059, and y^=7.95-0.324x. Where x= 3
Q: For 50 randomly selected speed dates, attractiveness ratings by males of their female date partners…
A:
Q: Suppose we consider the following model: Xt2 = b0 + b1X2t-1 + ut The estimation of the model…
A: The hypotheses are given below:Null hypothesis: H0:B1=0Alternative hypothesis: H1:B1≠0Rejection…
Q: For 50 randomly selected speed dates, attractiveness ratings by males of their female date partners…
A:
Q: 42. If X is a Poisson variate, such that P(X = 2)=9(X =4)+90P(X =6) %3D Find i) 1, the mean of X and…
A:
Q: For 50 randomly selected speed dates, attractiveness ratings by males of their female date partners…
A: Given, The regression equation is, The objective is to find the best predicted value of y^…
Q: For 50 randomly selected speed dates, attractiveness ratings by males of their female date partners…
A: Introduction: The estimated regression equation for predicting the attractiveness ratings of females…
Q: For 50 randomly selected speed dates, attractiveness ratings by males of their female date partners…
A: Given: Equation of linear regression is
Q: For 50 randomly selected speed dates, attractiveness ratings by males of their female date partners…
A: In this case, the regression is ŷ = 8.08 – 0.333x, where x is the attractiveness rating by males of…
Q: For 50 randomly selected speed dates, attractiveness ratings by males of their female date partners…
A: Given data: ssignificance level = 0.05 P-value = 0.087 To find: The best predicted value of y-cap.
Q: The test statistic of z=−1.81 is obtained when testing the claim that p<0.88. a. Using a…
A: Given: z=−1.81 the claim that p<0.88 α=0.01
Q: For 50 randomly selected speed dates, attractiveness ratings by males of their female date partners…
A: Given Information : For 50 randomly selected speed dates , attractiveness ratings by males o their…
Q: For 50 randomly selected speed dates, attractiveness ratings by males of their female date partners…
A: It is given that The equation of a best-fitted line between attractiveness ratings by males of their…
Q: = 0.10, find the critical value(s).
A: z=−1.55 and α=0.10
Q: For 50 randomly selected speed dates, attractiveness ratings by males of their female date partners…
A: Using the predicted equation y^=7.90-0.296x
Q: For 50 randomly selected speed dates, attractiveness ratings by males of their female date…
A: Solution: From the given information, the regression equation is y=7.81–0.293 x.
Q: For 50 randomly selected speed dates, attractiveness ratings by males of their female date partners…
A: Introduction: The estimated least squares regression equation to predict the attractiveness rating…
Q: The test statistic of z=−2.31 is obtained when testing the claim that p=1/2. a. Using a…
A: Given, test statistic of z=−2.31 p=1/2 = 0.5
Q: For 50 randomly selected speed dates, attractiveness ratings by males of their female date partnerS…
A: The p-value is 0.046.
Q: For 50 randomly selected speed dates, attractiveness ratings by males of their female date partners…
A: Given information- Sample size, n = 50 The mean value of attractiveness ratings by males of their…
Q: The test statistic of z=−2.97 is obtained when testing the claim that p=3/5. a. Using a…
A:
Q: For 50 randomly selected speed dates, attractiveness ratings by males of their female date partners…
A: Guven: r = -0.273 The negative and low value of correlation (-0.273) represents that there is a…
Q: For 50 randomly selected speed dates, attractiveness ratings by males of their female date partners…
A: Given y^=7.54-0.256*X
Q: The test statistic of z= -1.90 is obtained when testing the claim that p<0.26. a. Using a…
A:
Q: An experiment to compare the tension bond strength of polymer latex modified mortar (Portland cement…
A: Given Information : Let , μ1 denotes the true age tension bond strengths for modified mortars and…
Trending now
This is a popular solution!
Step by step
Solved in 2 steps with 1 images
- A marketing research group found that 25% of the 200 shoppers, it recently interviewed at a certain shopping center, resided more than 12 miles from the center. Assume that a random sample was taken, construct a 95% C.I. for the actual; percentage of shoppers who live more than 15 miles from that center.An organization published an article stating that in any one-year period, approximately 8.2 percent of adults in a country suffer from depression or a depressive illness. Suppose that in a survey of 100 people in a certain town, six of them suffered from depression or a depressive illness. Conduct a hypothesis test to determine if the true proportion of people in that town suffering from depression or a depressive illness is lower than the percent in the general adult population in the country. p' = Calculate ?x. Find the p-value.In a random sample of 320 cars driven at low altitudes, 50 of them exceeded a standard of 10 grams of particulate pollution per gallon of fuel consumed. In an independent random sample of 135 cars driven at high altitudes, 17 of them exceeded the standard. Can you conclude that the proportion of high-altitude vehicles exceeding the standard is less than the proportion of low-altitude vehicles exceeding the standard? Let p1 denote the proportion of low-altitude vehicles exceeding the standard and p2 denote the proportion of high-altitude vehicles exceeding the standard. Use the =α0.10 level of significance and the P -value method with the TI-84 Plus calculator. please state all steps to the p method clearly!
- In the tt-test of significance for the hypotheses H0:μ=11 and Ha:μ<11, the value of the test statistic was found to be t = 1.205 using a sample of size 18. Estimate the upper bound for the P-value associated with this test. That is, fill in the blank P <P< _____. Please show work!An SRS of 100 flights by Speedy Airlines showed that 64 were on time. An SRS of 100 flights by Happy Airlines showed that 80 were on time. Let pS be the proportion of on-time flights for all Speedy Airline flights, and let pH be the proportion of all on-time flights for all Happy Airlines flights. Is there evidence of a difference in the on-time rate for the two airlines? To determine this, you test the hypotheses H0 : pS – pH 0, Ha : pS – pH 0. The P-value of your test is 0.0117. Which of the following is an appropriate interpretation of the P-value? a. If the on-time rates for the two airlines are equal, there is a 0.0117 probability of getting samples with a difference as far or farther from zero as these samples. b. If the on-time rates for the two airlines are not equal, the probability of getting samples with a difference as far or farther from zero as these samples is 0.9883. c. The probability of making a Type I error is 0.0117. d. The probability of making a Type II error…In a clinical study, a random sample of 540 participants agree to have their blood drawn, which is to be examined for the presence of antibodies against a certain contagious disease. It is found in 22% of the blood samples, which experimenters hope to extrapolate to the general population. From this random sample, 10 participants' blood samples are selected at random. If X is the number of samples out of the 10 who have these antibodies, what can we say about X? A. The sample size is not large enough for us to approximate X using a normal distribution B.The expected value of X is 22 C. X can be approximated using a normal distribution in lieu of a binomial distribution D. X has a sampling distribution that is normal
- Suppose we want to compare the length of hospital stay for patients with the same diagnosis at two different hospitals. The results are shown in Table 9.10. 9.7 Why might a t test not be very useful in this case? 9.8 Carry out a nonparametric procedure for testing the hypothesis that lengths of stay are comparable in the two hospitals.A random sample of 80 poultry farms of one variety gave an average production of 240 eggs per bird. Another random sample of 50 poultry farms of another variety gave an average production of 195 eggs per bird. At a=0.05 is there sufficient evidence to support that there is a significant difference between the egg production of the two varieties of birds. Assume o1 =18 eggs and o2=15 eggsA foreign car manufacturer advertises that its newest model, the Bullet, rarely stops at gas stations. In fact, they claimed that its EPA rating for highway driving is at least 32.5 mpg. However, the results of a recent independent study determined the mpg for 50 identical models of the Bullet, with these results: n = 50, x= 30.4 mpg, and s = 5.3 mpg.This report failed to offer any conclusion, and you have been asked to interpret these results by someone who has always felt that the 32.5 figure is too high. What would be your conclusion using a significance level of 5%?Z = 1.645
- a major cereal manufacturer is awarding prize certificates in its #1 cereal. a random sample of 60 cereal boxes is selected and 5 are found to contain prize certificates. find the 90% C.I for the true proportion of prize certificates.A medical researcher says that less than 74%of adults in a certain country think that healthy children should be required to be vaccinated. In a random sample of 600adults in that country, 71% think that healthy children should be required to be vaccinated. At α=0.01, is there enough evidence to support the researcher's claim? Complete parts (a) through (e) below. (a) Identify the claim and state H0 andHa. Identify the claim in this scenario. Select the correct choice below and fill in the answer box to complete your choice. (Type an integer or a decimal. Do not round.) Fill the percentage on the correct answer A. % of adults in the country think that healthy children should be required to be vaccinated. B. Less than %of adults in the country think that healthy children should be required to be vaccinated. C. The percentage of adults in the country who think that healthy children should be required to be vaccinated is not %. D. More than…A manufacturer of light bulbs may want to be reasonably certain that less than 3% of the bulbs are defective. Suppose 300 bulbs are randomly selected from a very large shipment. Each tested and 10 defective bulbs are found. Does this provide sufficient evidence for the manufacturer to conclude that the fraction defective in the entire shipment is less than 0.03? The correct test statistic (rounded off to three decimals) is: A. Z = 0.338 B. T = 0.332 C. Z = - 0.322 D. Z = 0.321