In an educational study, there is interest in whether or not there is more variability in the mean verbal scores of 8-year-olds or of 3-year-ol


Contingency Table
A contingency table can be defined as the visual representation of the relationship between two or more categorical variables that can be evaluated and registered. It is a categorical version of the scatterplot, which is used to investigate the linear relationship between two variables. A contingency table is indeed a type of frequency distribution table that displays two variables at the same time.
Binomial Distribution
Binomial is an algebraic expression of the sum or the difference of two terms. Before knowing about binomial distribution, we must know about the binomial theorem.
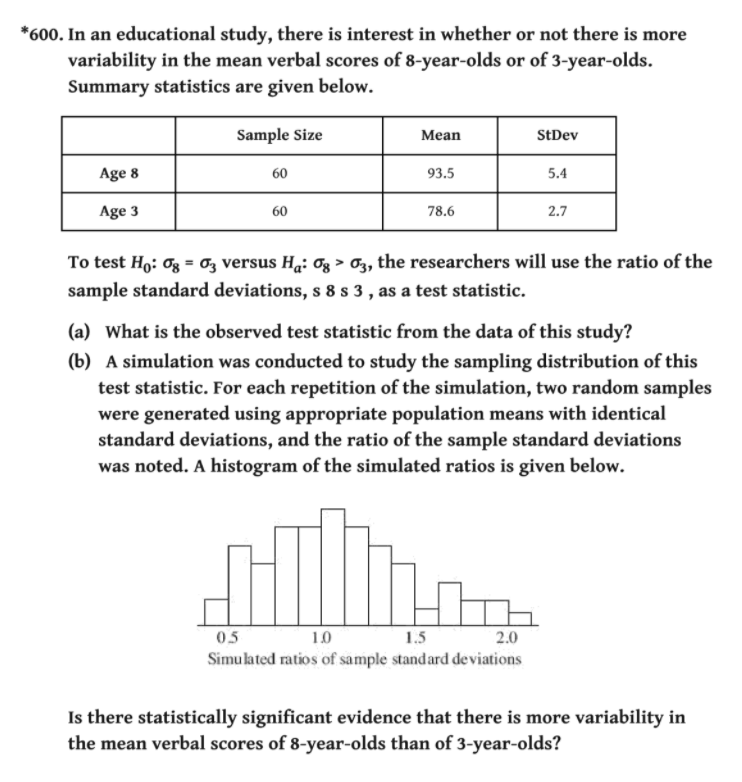
In an educational study, there is interest in whether or not there is more variability in the mean verbal scores of 8-year-olds or of 3-year-olds. Summary statistics are given below.
| Sample Size | Mean | St. Dev. | |
| Age 8 | 60 | 93.5 | 5.4 |
| Age 3 | 60 | 78.6 | 2.7 |
To test H0: σ8 = σ3 versues Ha: σ8 > σ3, the resaerchers will use the ratio of the sample satnadard deviations, s8/s3, as a test statistic.
a.) What is the observed test statistic from the data of this study?
b.) A simulation was conducted to study the sampling distribution of this test statistic. For each repetition of the simulation, two random samples were generated using appropriate population means with identical standard deviations, and the ratio of the sample standard deviations was noted. A histogram of the simulated ratios is given below.
(see attachement, histgram skewed to the right with values
Is there statistically significant evidence that there is more variability in the mean verbal scores of 8-year-olds than of 3-year-olds?

Step by step
Solved in 3 steps with 2 images


