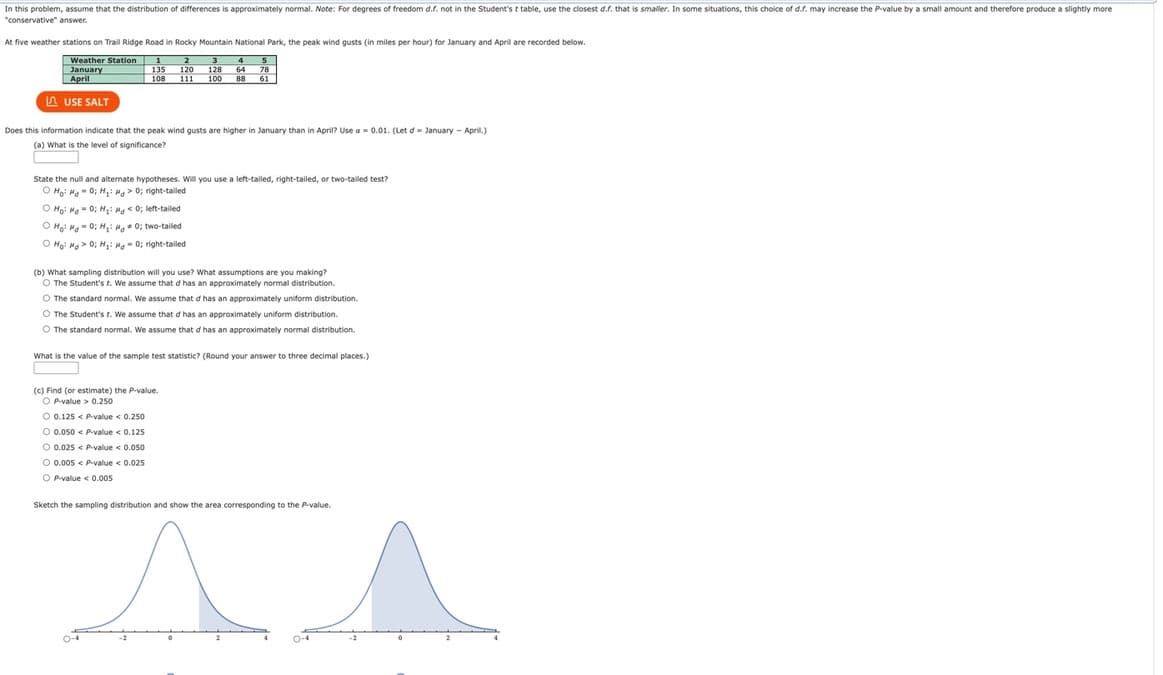
In this problem, assume that the distribution of differences is approximately normal. Note: For degrees of freedom d.f. not in the Student's t table, use the closest d.f. that is smaller. In some situations, this choice of d.f. may increase the P-value by a small amount and therefore produce a slightly more "conservative" answer. At five weather stations on Trail Ridge Road in Rocky Mountain National Park, the peak wind gusts (in miles per hour) for January and April are recorded below. 1 2 3 135 120 128 108 111 100 Weather Station January April USE SALT Does this information indicate that the peak wind gusts are higher in January than in April? Use a = 0.01. (Let d January - April.) (a) What is the level of significance? State the null and alternate hypotheses. Will you use a left-tailed, right-tailed, or two-tailed test? Ho H0; H₁: Mg> 0; right-tailed Ho: Mg0; H₂: Mg < 0; left-tailed Ho: Hg = 0; H₂ H * 0; two-tailed Hoi Ha> 0; H₁: Mg0; right-tailed 4 5 64 78 88 61 (b) What sampling distribution will you use? What assumptions are you making? O The Student's t. We assume that d has an approximately normal distribution. O The standard normal. We assume that d has an approximately uniform distribution. O The Student's t. We assume that d has an approximately uniform distribution. O The standard normal. We assume that d has an approximately normal distribution. What is the value of the sample test statistic? (Round your answer to three decimal places.) (c) Find (or estimate) the P-value. OP-value > 0.250 O 0.125 < P-value < 0.250 O 0.050 < P-value < 0.125 O 0.025 < P-value < 0.050 O 0.005 < P-value < 0.025 OP-value < 0.005 Sketch the sampling distribution and show the area corresponding to the P-value. ^ ^
In this problem, assume that the distribution of differences is approximately normal. Note: For degrees of freedom d.f. not in the Student's t table, use the closest d.f. that is smaller. In some situations, this choice of d.f. may increase the P-value by a small amount and therefore produce a slightly more "conservative" answer. At five weather stations on Trail Ridge Road in Rocky Mountain National Park, the peak wind gusts (in miles per hour) for January and April are recorded below. 1 2 3 135 120 128 108 111 100 Weather Station January April USE SALT Does this information indicate that the peak wind gusts are higher in January than in April? Use a = 0.01. (Let d January - April.) (a) What is the level of significance? State the null and alternate hypotheses. Will you use a left-tailed, right-tailed, or two-tailed test? Ho H0; H₁: Mg> 0; right-tailed Ho: Mg0; H₂: Mg < 0; left-tailed Ho: Hg = 0; H₂ H * 0; two-tailed Hoi Ha> 0; H₁: Mg0; right-tailed 4 5 64 78 88 61 (b) What sampling distribution will you use? What assumptions are you making? O The Student's t. We assume that d has an approximately normal distribution. O The standard normal. We assume that d has an approximately uniform distribution. O The Student's t. We assume that d has an approximately uniform distribution. O The standard normal. We assume that d has an approximately normal distribution. What is the value of the sample test statistic? (Round your answer to three decimal places.) (c) Find (or estimate) the P-value. OP-value > 0.250 O 0.125 < P-value < 0.250 O 0.050 < P-value < 0.125 O 0.025 < P-value < 0.050 O 0.005 < P-value < 0.025 OP-value < 0.005 Sketch the sampling distribution and show the area corresponding to the P-value. ^ ^

MATLAB: An Introduction with Applications
6th Edition
ISBN:9781119256830
Author:Amos Gilat
Publisher:Amos Gilat
Chapter1: Starting With Matlab
Section: Chapter Questions
Problem 1P

Related questions
Question
Transcribed Image Text:In this problem, assume that the distribution of differences is approximately normal. Note: For degrees of freedom d.f. not in the Student's t table, use the closest d.f. that is smaller. In some situations, this choice of d.f. may increase the P-value by a small amount and therefore produce a slightly more
"conservative" answer.
At five weather stations on Trail Ridge Road in Rocky Mountain National Park, the peak wind gusts (in miles per hour) for January and April are recorded below.
3 4 5
128 64 78
88 61
Weather Station
January
April
LUSE SALT
1 2
135 120
111 100
108
Does this information indicate that the peak wind gusts are higher in January than in April? Use a = 0.01. (Let d January - April.)
(a) What is the level of significance?
State the null and alternate hypotheses. Will you use a left-tailed, right-tailed, or two-tailed test?
Ho: MgO; H₁: Mg> 0; right-tailed
Ho: Mg = 0; M₁: Mg < 0; left-tailed
Ho: Mg0; H₂: Mg0; two-tailed
Hoi Ha> 0; H₁: Mg0; right-tailed
(b) What sampling distribution will you use? What assumptions are you making?
O The Student's t. We assume that d has an approximately normal distribution.
O The standard normal. We assume that d has an approximately uniform distribution.
O The Student's t. We assume that d has an approximately uniform distribution.
O The standard normal. We assume that d has an approximately normal distribution.
What is the value of the sample test statistic? (Round your answer to three decimal places.)
(c) Find (or estimate) the P-value.
OP-value>
> 0.250
O 0.125 < P-value < 0.250
O 0.050 < P-value < 0.125
O 0.025 < P-value < 0.050
O 0.005
< 0.025
O
OP-value < 0.005
Sketch the sampling distribution and show the area corresponding to the P-value.
^
^
Expert Solution
This question has been solved!
Explore an expertly crafted, step-by-step solution for a thorough understanding of key concepts.

Step by step
Solved in 3 steps with 3 images

Recommended textbooks for you
MATLAB: An Introduction with Applications
Statistics
ISBN:
9781119256830
Author:
Amos Gilat
Publisher:
John Wiley & Sons Inc

Probability and Statistics for Engineering and th…
Statistics
ISBN:
9781305251809
Author:
Jay L. Devore
Publisher:
Cengage Learning

Statistics for The Behavioral Sciences (MindTap C…
Statistics
ISBN:
9781305504912
Author:
Frederick J Gravetter, Larry B. Wallnau
Publisher:
Cengage Learning
MATLAB: An Introduction with Applications
Statistics
ISBN:
9781119256830
Author:
Amos Gilat
Publisher:
John Wiley & Sons Inc
Probability and Statistics for Engineering and th…
Statistics
ISBN:
9781305251809
Author:
Jay L. Devore
Publisher:
Cengage Learning
Statistics for The Behavioral Sciences (MindTap C…
Statistics
ISBN:
9781305504912
Author:
Frederick J Gravetter, Larry B. Wallnau
Publisher:
Cengage Learning

Elementary Statistics: Picturing the World (7th E…
Statistics
ISBN:
9780134683416
Author:
Ron Larson, Betsy Farber
Publisher:
PEARSON

The Basic Practice of Statistics
Statistics
ISBN:
9781319042578
Author:
David S. Moore, William I. Notz, Michael A. Fligner
Publisher:
W. H. Freeman

Introduction to the Practice of Statistics
Statistics
ISBN:
9781319013387
Author:
David S. Moore, George P. McCabe, Bruce A. Craig
Publisher:
W. H. Freeman