In this problem, assume that the distribution of differences is approximately normal. Note: For degrees of freedom d.f. not in the Student's t table, use the closest d.f. that is smaller. In some situations, this choice of d.f. may increase the P-value by a small amount and therefore produce a slightly more "conservative" answer. Suppose that at five weather stations on Trail Ridge Road in Rocky Mountain National Park, the peak wind gusts (in miles per hour) for January and April are recorded below.
In this problem, assume that the distribution of differences is approximately normal. Note: For degrees of freedom d.f. not in the Student's t table, use the closest d.f. that is smaller. In some situations, this choice of d.f. may increase the P-value by a small amount and therefore produce a slightly more "conservative" answer. Suppose that at five weather stations on Trail Ridge Road in Rocky Mountain National Park, the peak wind gusts (in miles per hour) for January and April are recorded below.

Glencoe Algebra 1, Student Edition, 9780079039897, 0079039898, 2018
18th Edition
ISBN:9780079039897
Author:Carter
Publisher:Carter
Chapter10: Statistics
Section10.4: Distributions Of Data
Problem 19PFA

Related questions
Topic Video
Question
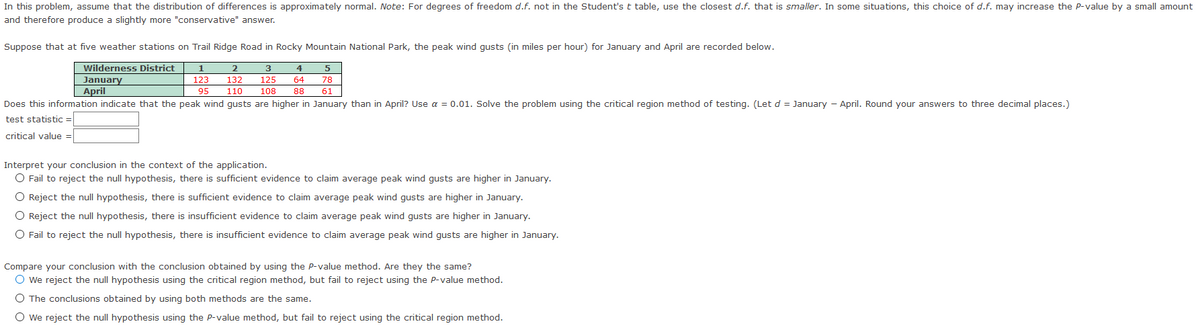
In this problem, assume that the distribution of differences is approximately normal. Note: For degrees of freedom d.f. not in the Student's t table, use the closest d.f. that is smaller. In some situations, this choice of d.f. may increase the P-value by a small amount and therefore produce a slightly more "conservative" answer.
Suppose that at five weather stations on Trail Ridge Road in Rocky Mountain National Park, the peak wind gusts (in miles per hour) for January and April are recorded below.
Transcribed Image Text:In this problem, assume that the distribution of differences is approximately normal. Note: For degrees of freedom d.f. not in the Student'st table, use the closest d.f. that is smaller. In some situations, this choice of d.f. may increase the P-value by a small amount
and therefore produce a slightly more "conservative" answer.
Suppose that at five weather stations on Trail Ridge Road in Rocky Mountain National Park, the peak wind gusts (in miles per hour) for January and April are recorded below.
Wilderness District
1
3
4
January
April
123
132
125
64
78
95
110
108
88
61
Does this information indicate that the peak wind gusts are higher in January than in April? Use a = 0.01. Solve the problem using the critical region method of testing. (Let d = January - April. Round your answers to three decimal places.)
test statistic =
critical value =
Interpret your conclusion in the context of the application.
O Fail to reject the null hypothesis, there is sufficient evidence to claim average peak wind gusts are higher in January.
O Reject the null hypothesis, there is sufficient evidence to claim average peak wind gusts are higher in January.
O Reject the null hypothesis, there is insufficient evidence to claim average peak wind gusts are higher in January.
O Fail to reject the null hypothesis, there is insufficient evidence to claim average peak wind gusts are higher in January.
Compare your conclusion with the conclusion obtained by using the Pp-value method. Are they the same?
O we reject the null hypothesis using the critical region method, but fail to reject using the P-value method.
O The conclusions obtained by using both methods are the same.
O we reject the null hypothesis using the P-value method, but fail to reject using the critical region method.
Expert Solution
This question has been solved!
Explore an expertly crafted, step-by-step solution for a thorough understanding of key concepts.

Step by step
Solved in 7 steps

Knowledge Booster


Learn more about
Need a deep-dive on the concept behind this application? Look no further. Learn more about this topic, statistics and related others by exploring similar questions and additional content below.Recommended textbooks for you
Glencoe Algebra 1, Student Edition, 9780079039897…
Algebra
ISBN:
9780079039897
Author:
Carter
Publisher:
McGraw Hill
Glencoe Algebra 1, Student Edition, 9780079039897…
Algebra
ISBN:
9780079039897
Author:
Carter
Publisher:
McGraw Hill