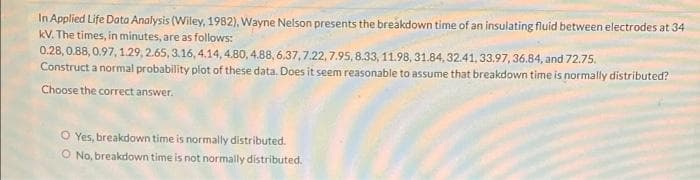
In Applied Life Data Analysis (Wiley, 1982), Wayne Nelson presents the breakdown time of an insulating fluid between electrodes at 34 kV. The times, in minutes, are as follows: 0.28, 0.88, 0.97, 1.29, 2.65, 3.16, 4.14, 4.80, 4.88, 6.37,7.22,7.95, 8.33, 11.98, 31.84, 32.41, 33.97, 36.84, and 72.75. Construct a normal probability plot of these data. Does it seem reasonable to assume that breakdown time is normally distributed? Choose the correct answer. O Yes, breakdown time is normally distributed. O No, breakdown time is not normally distributed.
In Applied Life Data Analysis (Wiley, 1982), Wayne Nelson presents the breakdown time of an insulating fluid between electrodes at 34 kV. The times, in minutes, are as follows: 0.28, 0.88, 0.97, 1.29, 2.65, 3.16, 4.14, 4.80, 4.88, 6.37,7.22,7.95, 8.33, 11.98, 31.84, 32.41, 33.97, 36.84, and 72.75. Construct a normal probability plot of these data. Does it seem reasonable to assume that breakdown time is normally distributed? Choose the correct answer. O Yes, breakdown time is normally distributed. O No, breakdown time is not normally distributed.

Linear Algebra: A Modern Introduction
4th Edition
ISBN:9781285463247
Author:David Poole
Publisher:David Poole
Chapter7: Distance And Approximation
Section7.3: Least Squares Approximation
Problem 31EQ

Related questions
Question
Transcribed Image Text:In Applied Life Data Analysis (Wiley, 1982), Wayne Nelson presents the breakdown time of an insulating fluid between electrodes at 34
kV. The times, in minutes, are as follows:
0.28, 0.88, 0.97, 1.29, 2.65, 3.16, 4.14, 4.80, 4.88, 6.37,7.22,7.95, 8.33, 11.98, 31.84, 32.41, 33.97, 36.84, and 72.75.
Construct a normal probability plot of these data. Does it seem reasonable to assume that breakdown time is normally distributed?
Choose the correct answer.
O Yes, breakdown time is normally distributed.
O No, breakdown time is not normally distributed.
Expert Solution
This question has been solved!
Explore an expertly crafted, step-by-step solution for a thorough understanding of key concepts.

This is a popular solution!

Trending now
This is a popular solution!

Step by step
Solved in 2 steps with 2 images

Recommended textbooks for you
Linear Algebra: A Modern Introduction
Algebra
ISBN:
9781285463247
Author:
David Poole
Publisher:
Cengage Learning

Functions and Change: A Modeling Approach to Coll…
Algebra
ISBN:
9781337111348
Author:
Bruce Crauder, Benny Evans, Alan Noell
Publisher:
Cengage Learning

Glencoe Algebra 1, Student Edition, 9780079039897…
Algebra
ISBN:
9780079039897
Author:
Carter
Publisher:
McGraw Hill
Linear Algebra: A Modern Introduction
Algebra
ISBN:
9781285463247
Author:
David Poole
Publisher:
Cengage Learning
Functions and Change: A Modeling Approach to Coll…
Algebra
ISBN:
9781337111348
Author:
Bruce Crauder, Benny Evans, Alan Noell
Publisher:
Cengage Learning
Glencoe Algebra 1, Student Edition, 9780079039897…
Algebra
ISBN:
9780079039897
Author:
Carter
Publisher:
McGraw Hill