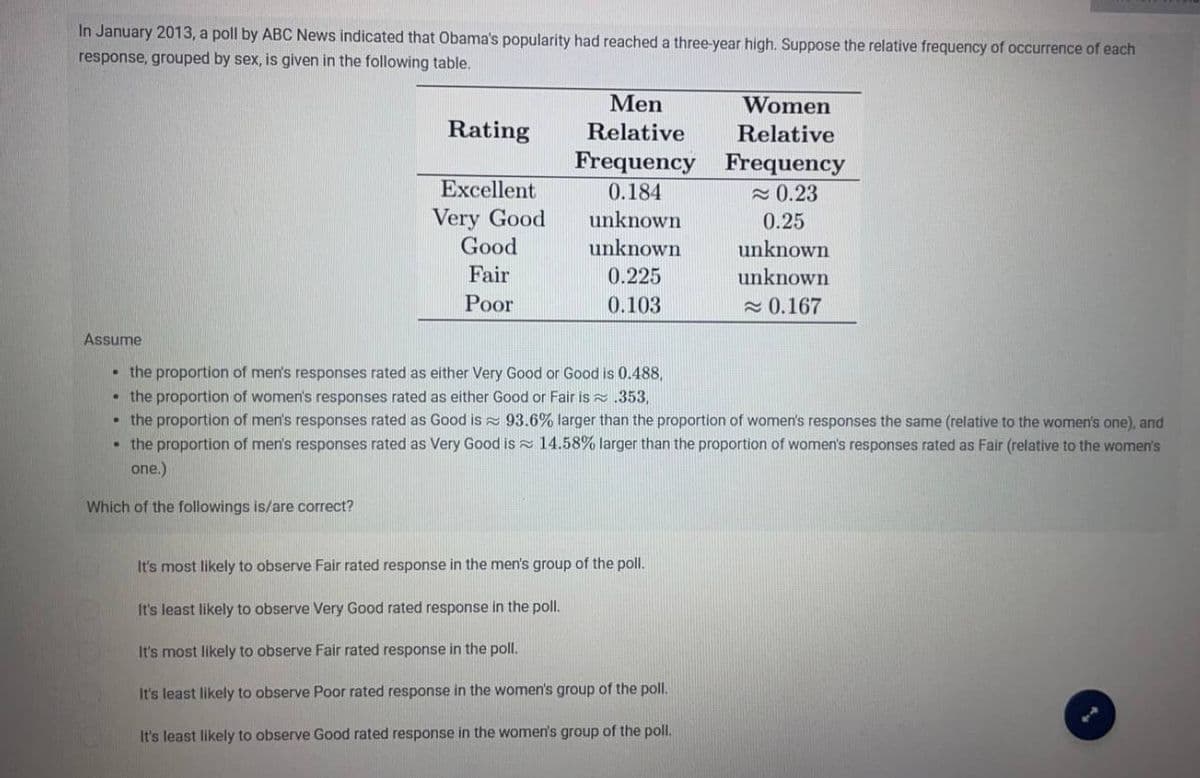
In January 2013, a poll by ABC News indicated that Obama's popularity had reached a three-year high. Suppose the relative frequency of occurrence of each response, grouped by sex, is given in the following table. Rating Excellent Very Good Good Fair Poor Men Relative Frequency 0.184 unknown unknown 0.225 0.103 Women Relative Frequency ≈ 0.23 0.25 unknown unknown ≈ 0.167
In January 2013, a poll by ABC News indicated that Obama's popularity had reached a three-year high. Suppose the relative frequency of occurrence of each response, grouped by sex, is given in the following table. Rating Excellent Very Good Good Fair Poor Men Relative Frequency 0.184 unknown unknown 0.225 0.103 Women Relative Frequency ≈ 0.23 0.25 unknown unknown ≈ 0.167

Glencoe Algebra 1, Student Edition, 9780079039897, 0079039898, 2018
18th Edition
ISBN:9780079039897
Author:Carter
Publisher:Carter
Chapter10: Statistics
Section10.6: Summarizing Categorical Data
Problem 10CYU

Related questions
Question
Transcribed Image Text:In January 2013, a poll by ABC News indicated that Obama's popularity had reached a three-year high. Suppose the relative frequency of occurrence of each
response, grouped by sex, is given in the following table.
Rating
Excellent
Very Good
Good
Fair
Poor
Men
Relative
Frequency
0.184
unknown
unknown
0.225
0.103
Women
Relative
It's most likely to observe Fair rated response in the men's group of the poll.
It's least likely to observe Very Good rated response in the poll.
It's most likely to observe Fair rated response in the poll.
It's least likely to observe Poor rated response in the women's group of the poll.
It's least likely to observe Good rated response in the women's group of the poll.
Frequency
≈ 0.23
0.25
unknown
unknown
≈ 0.167
Assume
• the proportion of men's responses rated as either Very Good or Good is 0.488,
• the proportion of women's responses rated as either Good or Fair is≈ .353,
• the proportion of men's responses rated as Good is
93.6% larger than the proportion of women's responses the same (relative to the women's one), and
• the proportion of men's responses rated as Very Good is 14.58% larger than the proportion of women's responses rated as Fair (relative to the women's
one.)
Which of the followings is/are correct?
"
Expert Solution
This question has been solved!
Explore an expertly crafted, step-by-step solution for a thorough understanding of key concepts.

Step by step
Solved in 2 steps

Recommended textbooks for you
Glencoe Algebra 1, Student Edition, 9780079039897…
Algebra
ISBN:
9780079039897
Author:
Carter
Publisher:
McGraw Hill
Glencoe Algebra 1, Student Edition, 9780079039897…
Algebra
ISBN:
9780079039897
Author:
Carter
Publisher:
McGraw Hill