In one study, a researcher compared the level of job satisfaction of Generation X (born: 1965-1980) employees and Millennial (born: 1981-1996) employees in a job where the employees have to upgrade their IT (Information Technology) skills to cope with the demands of working online this pandemic. The employees were asked to answer a job satisfaction survey with 1 as the lowest score and 10 as the highest score. The data are as follows: 2. The means of each group with 20 participants each are: Generation X: X1 = 7.4 Millennials: X2 = 8.5 The t value = 2.8751 and the critical values at @ .05 are +/- 2.1241.
In one study, a researcher compared the level of job satisfaction of Generation X (born: 1965-1980) employees and Millennial (born: 1981-1996) employees in a job where the employees have to upgrade their IT (Information Technology) skills to cope with the demands of working online this pandemic. The employees were asked to answer a job satisfaction survey with 1 as the lowest score and 10 as the highest score. The data are as follows: 2. The means of each group with 20 participants each are: Generation X: X1 = 7.4 Millennials: X2 = 8.5 The t value = 2.8751 and the critical values at @ .05 are +/- 2.1241.

Glencoe Algebra 1, Student Edition, 9780079039897, 0079039898, 2018
18th Edition
ISBN:9780079039897
Author:Carter
Publisher:Carter
Chapter10: Statistics
Section10.6: Summarizing Categorical Data
Problem 10CYU

Related questions
Question
Answer the following
a. problem
b. null hypothesis
c. statistical interpretation
d. conclusion
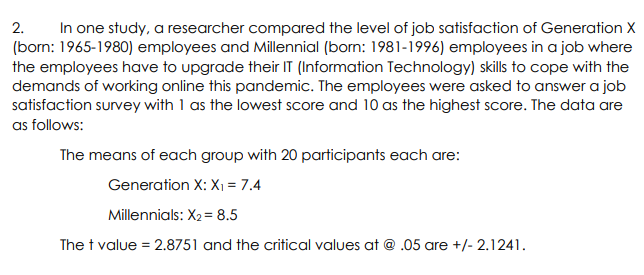
Transcribed Image Text:In one study, a researcher compared the level of job satisfaction of Generation X
(born: 1965-1980) employees and Millennial (born: 1981-1996) employees in a job where
the employees have to upgrade their IT (Information Technology) skills to cope with the
demands of working online this pandemic. The employees were asked to answer a job
satisfaction survey with 1 as the lowest score and 10 as the highest score. The data are
as follows:
2.
The means of each group with 20 participants each are:
Generation X: X1 = 7.4
Millennials: X2= 8.5
The t value = 2.8751 and the critical values at @ .05 are +/- 2.1241.
Expert Solution
This question has been solved!
Explore an expertly crafted, step-by-step solution for a thorough understanding of key concepts.

Step by step
Solved in 2 steps with 2 images

Recommended textbooks for you
Glencoe Algebra 1, Student Edition, 9780079039897…
Algebra
ISBN:
9780079039897
Author:
Carter
Publisher:
McGraw Hill

Linear Algebra: A Modern Introduction
Algebra
ISBN:
9781285463247
Author:
David Poole
Publisher:
Cengage Learning

Big Ideas Math A Bridge To Success Algebra 1: Stu…
Algebra
ISBN:
9781680331141
Author:
HOUGHTON MIFFLIN HARCOURT
Publisher:
Houghton Mifflin Harcourt
Glencoe Algebra 1, Student Edition, 9780079039897…
Algebra
ISBN:
9780079039897
Author:
Carter
Publisher:
McGraw Hill
Linear Algebra: A Modern Introduction
Algebra
ISBN:
9781285463247
Author:
David Poole
Publisher:
Cengage Learning
Big Ideas Math A Bridge To Success Algebra 1: Stu…
Algebra
ISBN:
9781680331141
Author:
HOUGHTON MIFFLIN HARCOURT
Publisher:
Houghton Mifflin Harcourt