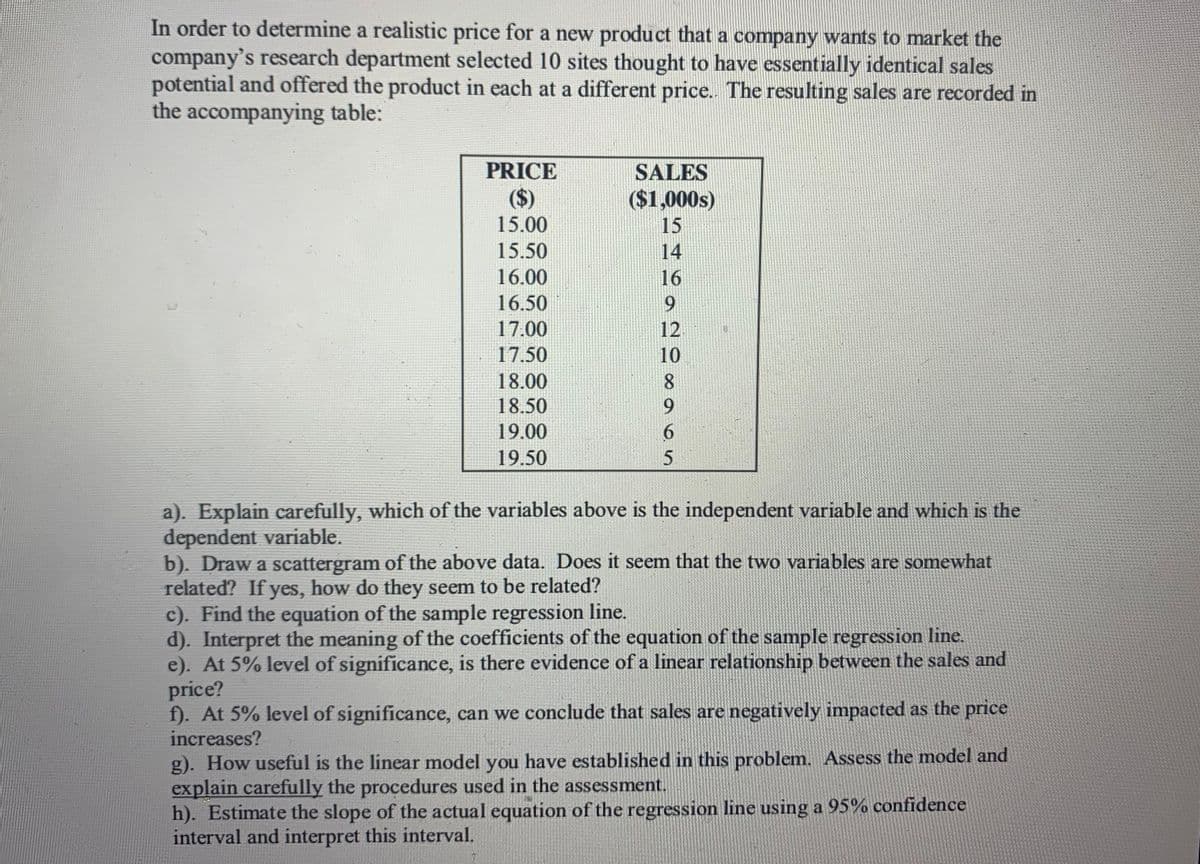
In order to determine a realistic price for a new product that a company wants to market the company's research department selected 10 sites thought to have essentially identical sales potential and offered the product in each at a different price. The resulting sales are recorded in the accompanying table: PRICE ($) 15.00 15.50 SALES ($1,000s) 15 14 16.00 16 16.50 9. 17.00 12 17.50 10 18.00 8 18.50 9. 19.00 6. 19.50
In order to determine a realistic price for a new product that a company wants to market the company's research department selected 10 sites thought to have essentially identical sales potential and offered the product in each at a different price. The resulting sales are recorded in the accompanying table: PRICE ($) 15.00 15.50 SALES ($1,000s) 15 14 16.00 16 16.50 9. 17.00 12 17.50 10 18.00 8 18.50 9. 19.00 6. 19.50

MATLAB: An Introduction with Applications
6th Edition
ISBN:9781119256830
Author:Amos Gilat
Publisher:Amos Gilat
Chapter1: Starting With Matlab
Section: Chapter Questions
Problem 1P

Related questions

Question
Please solve from E to F
Transcribed Image Text:In order to determine a realistic price for a new product that a company wants to market the
company's research department selected 10 sites thought to have essentially identical sales
potential and offered the product in each at a different price. The resulting sales are recorded in
the accompanying table:
PRICE
SALES
($)
($1,000s)
15.00
15
15.50
14
16.00
16
16.50
9.
17.00
12
17.50
10
18.00
18.50
9.
19.00
6.
19.50
a). Explain carefully, which of the variables above is the independent variable and which is the
dependent variable.
b). Draw a scattergram of the above data. Does it seem that the two variables are somewhat
related? If yes, how do they seem to be related?
c). Find the equation of the sample regression line.
d). Interpret the meaning of the coefficients of the equation of the sample regression line.
e). At 5% level of significance, is there evidence of a linear relationship between the sales and
price?
f). At 5% level of significance, can we conclude that sales are negatively impacted as the price
increases?
g). How useful is the linear model you have established in this problem. Assess the model and
explain carefully the procedures used in the assessment.
h). Estimate the slope of the actual equation of the regression line using a 95% confidence
interval and interpret this interval.
Expert Solution
This question has been solved!
Explore an expertly crafted, step-by-step solution for a thorough understanding of key concepts.

Step by step
Solved in 2 steps

Knowledge Booster


Learn more about
Need a deep-dive on the concept behind this application? Look no further. Learn more about this topic, statistics and related others by exploring similar questions and additional content below.Recommended textbooks for you
MATLAB: An Introduction with Applications
Statistics
ISBN:
9781119256830
Author:
Amos Gilat
Publisher:
John Wiley & Sons Inc

Probability and Statistics for Engineering and th…
Statistics
ISBN:
9781305251809
Author:
Jay L. Devore
Publisher:
Cengage Learning

Statistics for The Behavioral Sciences (MindTap C…
Statistics
ISBN:
9781305504912
Author:
Frederick J Gravetter, Larry B. Wallnau
Publisher:
Cengage Learning
MATLAB: An Introduction with Applications
Statistics
ISBN:
9781119256830
Author:
Amos Gilat
Publisher:
John Wiley & Sons Inc
Probability and Statistics for Engineering and th…
Statistics
ISBN:
9781305251809
Author:
Jay L. Devore
Publisher:
Cengage Learning
Statistics for The Behavioral Sciences (MindTap C…
Statistics
ISBN:
9781305504912
Author:
Frederick J Gravetter, Larry B. Wallnau
Publisher:
Cengage Learning

Elementary Statistics: Picturing the World (7th E…
Statistics
ISBN:
9780134683416
Author:
Ron Larson, Betsy Farber
Publisher:
PEARSON

The Basic Practice of Statistics
Statistics
ISBN:
9781319042578
Author:
David S. Moore, William I. Notz, Michael A. Fligner
Publisher:
W. H. Freeman

Introduction to the Practice of Statistics
Statistics
ISBN:
9781319013387
Author:
David S. Moore, George P. McCabe, Bruce A. Craig
Publisher:
W. H. Freeman