In order to determine if weather conditions play a significant role in how a disease effects wheat, fields of wheat are exposed to this disease over three consecutive summers, 2002-2004. The fields are later rated on a scale of 0.0 (resistant) to 10.0 (susceptible) based on how the disease has infected the field. The results are shown below along with the ANOVA table. At the 95% confidence level, compare the mean scores across the three years. 2002 2003 2004 7 7.3 5 4.7 8 3 8 5 2 3.3 3.3 7 6.3 4.7 7.3 7 3.7 8 7 4.3 6. 7 4.3 2 6.3 6.7 ANOVA Source of Variation df MS Treatment 20.97333 2 10.48667 4.127165 Error 76.22667 30 2.540889 Total 97.2 32
In order to determine if weather conditions play a significant role in how a disease effects wheat, fields of wheat are exposed to this disease over three consecutive summers, 2002-2004. The fields are later rated on a scale of 0.0 (resistant) to 10.0 (susceptible) based on how the disease has infected the field. The results are shown below along with the ANOVA table. At the 95% confidence level, compare the mean scores across the three years. 2002 2003 2004 7 7.3 5 4.7 8 3 8 5 2 3.3 3.3 7 6.3 4.7 7.3 7 3.7 8 7 4.3 6. 7 4.3 2 6.3 6.7 ANOVA Source of Variation df MS Treatment 20.97333 2 10.48667 4.127165 Error 76.22667 30 2.540889 Total 97.2 32

College Algebra (MindTap Course List)
12th Edition
ISBN:9781305652231
Author:R. David Gustafson, Jeff Hughes
Publisher:R. David Gustafson, Jeff Hughes
Chapter8: Sequences, Series, And Probability
Section8.7: Probability
Problem 58E: What is meant by the sample space of an experiment?

Related questions
Question
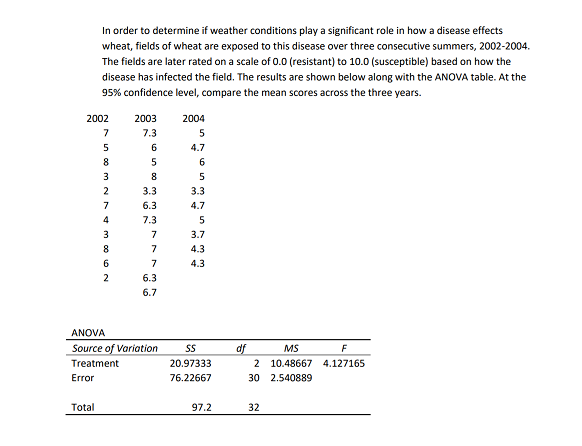
Transcribed Image Text:In order to determine if weather conditions play a significant role in how a disease effects
wheat, fields of wheat are exposed to this disease over three consecutive summers, 2002-2004.
The fields are later rated on a scale of 0.0 (resistant) to 10.0 (susceptible) based on how the
disease has infected the field. The results are shown below along with the ANOVA table. At the
95% confidence level, compare the mean scores across the three years.
2002
2003
2004
7
7.3
5
4.7
8
3
8
5
2
3.3
3.3
7
6.3
4.7
7.3
7
3.7
8
7
4.3
6.
7
4.3
2
6.3
6.7
ANOVA
Source of Variation
df
MS
Treatment
20.97333
2 10.48667 4.127165
Error
76.22667
30 2.540889
Total
97.2
32
Expert Solution
This question has been solved!
Explore an expertly crafted, step-by-step solution for a thorough understanding of key concepts.

Step by step
Solved in 2 steps with 1 images

Recommended textbooks for you
College Algebra (MindTap Course List)
Algebra
ISBN:
9781305652231
Author:
R. David Gustafson, Jeff Hughes
Publisher:
Cengage Learning
College Algebra (MindTap Course List)
Algebra
ISBN:
9781305652231
Author:
R. David Gustafson, Jeff Hughes
Publisher:
Cengage Learning