Researchers at the National Cancer Institute released the results of a study that examined the effect of weed-killing herbicides on house pets. Dogs were examined for the presence of malignant lymphoma. The data gathered is as follows: Sample Size Number with Lymphoma p Group Home used weed-killer Home did not use weed-killer 827 473 0.572 130 19 0.146 Construct a 95% confidence interval for the difference of the true proportions of exposed dogs that develop lymphoma and unexposed dogs that develop lymphoma. a) Can we use our confidence interval in part a) to conclude that the true proportion of exposed dogs that develon lymphoma ie high
Researchers at the National Cancer Institute released the results of a study that examined the effect of weed-killing herbicides on house pets. Dogs were examined for the presence of malignant lymphoma. The data gathered is as follows: Sample Size Number with Lymphoma p Group Home used weed-killer Home did not use weed-killer 827 473 0.572 130 19 0.146 Construct a 95% confidence interval for the difference of the true proportions of exposed dogs that develop lymphoma and unexposed dogs that develop lymphoma. a) Can we use our confidence interval in part a) to conclude that the true proportion of exposed dogs that develon lymphoma ie high

Glencoe Algebra 1, Student Edition, 9780079039897, 0079039898, 2018
18th Edition
ISBN:9780079039897
Author:Carter
Publisher:Carter
Chapter10: Statistics
Section10.3: Measures Of Spread
Problem 1GP

Related questions

Topic Video
Question
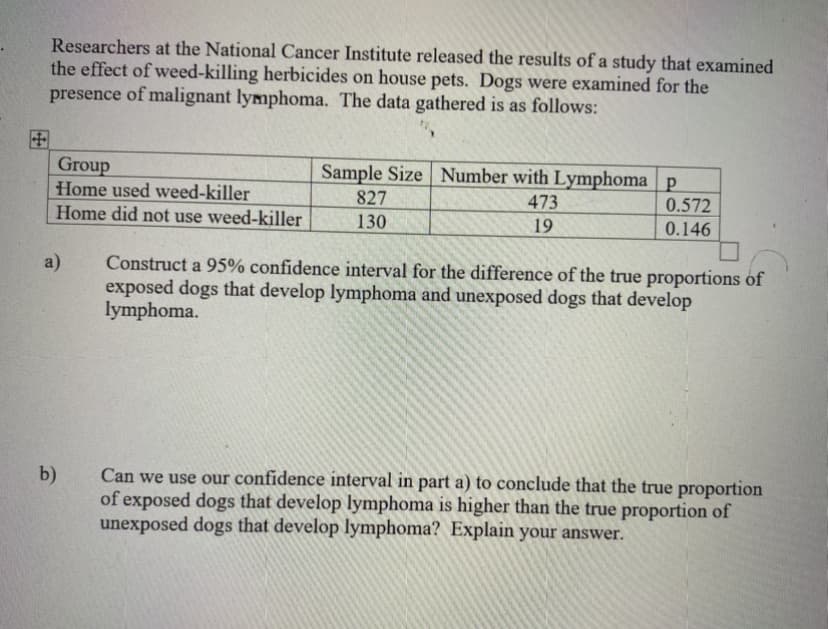
Transcribed Image Text:Researchers at the National Cancer Institute released the results of a study that examined
the effect of weed-killing herbicides on house pets. Dogs were examined for the
presence of malignant lymphoma. The data gathered is as follows:
国
Group
Home used weed-killer
Home did not use weed-killer
Sample Size Number with Lymphoma p
827
473
0.572
130
19
0.146
Construct a 95% confidence interval for the difference of the true proportions of
exposed dogs that develop lymphoma and unexposed dogs that develop
lymphoma.
a)
Can we use our confidence interval in part a) to conclude that the true proportion
of exposed dogs that develop lymphoma is higher than the true proportion of
unexposed dogs that develop lymphoma? Explain your answer.
b)
Expert Solution
This question has been solved!
Explore an expertly crafted, step-by-step solution for a thorough understanding of key concepts.

This is a popular solution!

Trending now
This is a popular solution!

Step by step
Solved in 2 steps with 1 images

Knowledge Booster


Learn more about
Need a deep-dive on the concept behind this application? Look no further. Learn more about this topic, statistics and related others by exploring similar questions and additional content below.Recommended textbooks for you
Glencoe Algebra 1, Student Edition, 9780079039897…
Algebra
ISBN:
9780079039897
Author:
Carter
Publisher:
McGraw Hill
Glencoe Algebra 1, Student Edition, 9780079039897…
Algebra
ISBN:
9780079039897
Author:
Carter
Publisher:
McGraw Hill