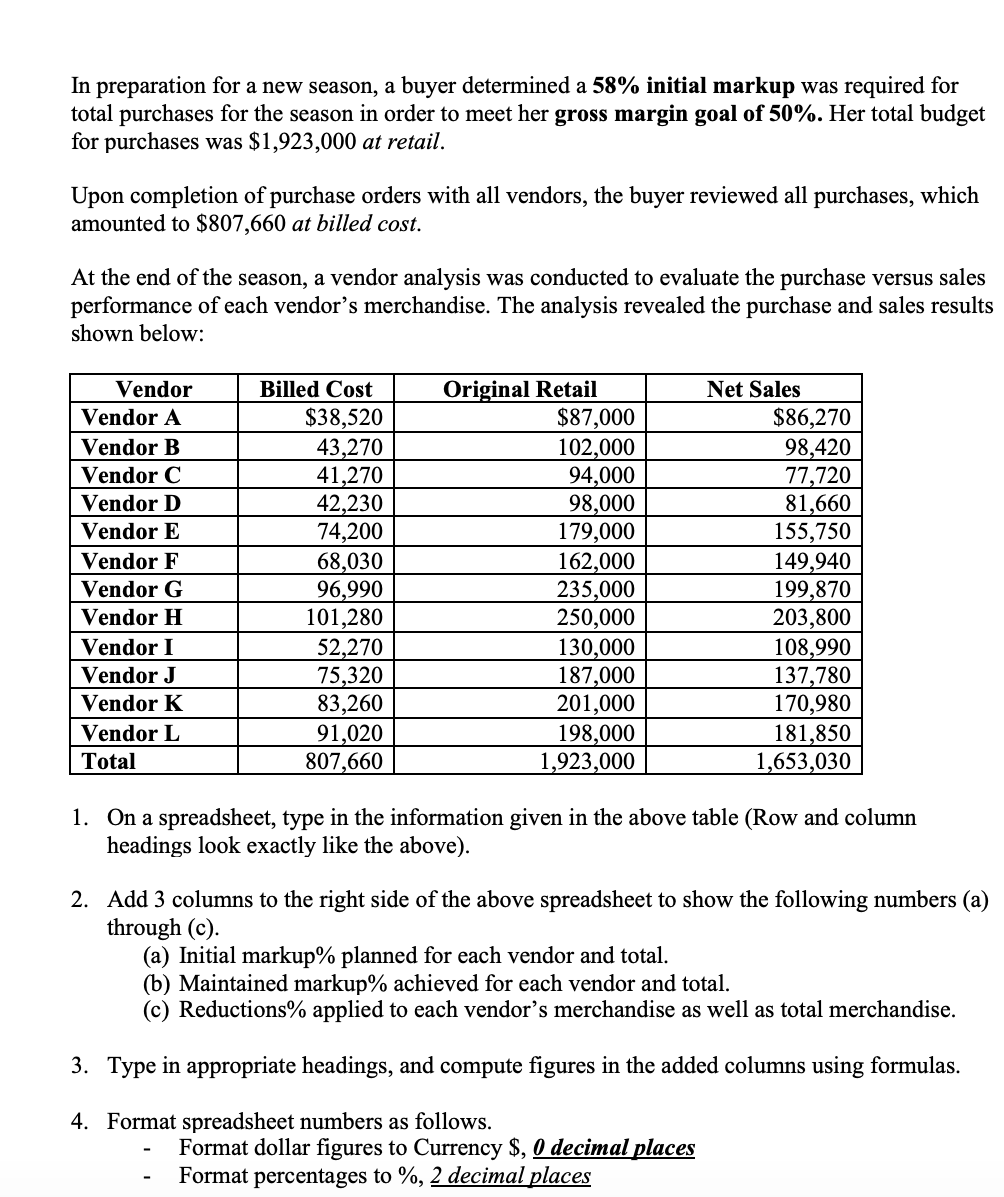
In preparation for a new season, a buyer determined a 58% initial markup was required for total purchases for the season in order to meet her gross margin goal of 50%. Her total budget for purchases was $1,923,000 at retail. Upon completion of purchase orders with all vendors, the buyer reviewed all purchases, which amounted to $807,660 at billed cost. At the end of the season, a vendor analysis was conducted to evaluate the purchase versus sales performance of each vendor's merchandise. The analysis revealed the purchase and sales results shown below: Original Retail $87,000 102,000 94,000 98,000 179,000 162,000 235,000 250,000 130,000 187,000 201,000 198,000 1,923,000 Vendor Billed Cost Net Sales Vendor A $38,520 43,270 41,270 42,230 74,200 68,030 96,990 101,280 52,270 75,320 83,260 91,020 807,660 $86,270 98,420 77,720 81,660 155,750 149,940 199,870 203,800 108,990 137,780 170,980 181,850 1,653,030 Vendor B Vendor C Vendor D Vendor E Vendor F Vendor G Vendor H Vendor I Vendor J Vendor K Vendor L Total 1. On a spreadsheet, type in the information given in the above table (Row and column headings look exactly like the above). 2. Add 3 columns to the right side of the above spreadsheet to show the following numbers (a) through (c). (a) Initial markup% planned for each vendor and total. (b) Maintained markup% achieved for each vendor and total. (c) Reductions% applied to each vendor's merchandise as well as total merchandise. 3. Type in appropriate headings, and compute figures in the added columns using formulas. 4. Format spreadsheet numbers as follows. Format dollar figures to Currency $, 0 decimal places Format percentages to %, 2 decimal places
In preparation for a new season, a buyer determined a 58% initial markup was required for total purchases for the season in order to meet her gross margin goal of 50%. Her total budget for purchases was $1,923,000 at retail. Upon completion of purchase orders with all vendors, the buyer reviewed all purchases, which amounted to $807,660 at billed cost. At the end of the season, a vendor analysis was conducted to evaluate the purchase versus sales performance of each vendor's merchandise. The analysis revealed the purchase and sales results shown below: Original Retail $87,000 102,000 94,000 98,000 179,000 162,000 235,000 250,000 130,000 187,000 201,000 198,000 1,923,000 Vendor Billed Cost Net Sales Vendor A $38,520 43,270 41,270 42,230 74,200 68,030 96,990 101,280 52,270 75,320 83,260 91,020 807,660 $86,270 98,420 77,720 81,660 155,750 149,940 199,870 203,800 108,990 137,780 170,980 181,850 1,653,030 Vendor B Vendor C Vendor D Vendor E Vendor F Vendor G Vendor H Vendor I Vendor J Vendor K Vendor L Total 1. On a spreadsheet, type in the information given in the above table (Row and column headings look exactly like the above). 2. Add 3 columns to the right side of the above spreadsheet to show the following numbers (a) through (c). (a) Initial markup% planned for each vendor and total. (b) Maintained markup% achieved for each vendor and total. (c) Reductions% applied to each vendor's merchandise as well as total merchandise. 3. Type in appropriate headings, and compute figures in the added columns using formulas. 4. Format spreadsheet numbers as follows. Format dollar figures to Currency $, 0 decimal places Format percentages to %, 2 decimal places

Cornerstones of Cost Management (Cornerstones Series)
4th Edition
ISBN:9781305970663
Author:Don R. Hansen, Maryanne M. Mowen
Publisher:Don R. Hansen, Maryanne M. Mowen
Chapter8: Budgeting For Planning And Control
Section: Chapter Questions
Problem 11CE: Shalimar Company manufactures and sells industrial products. For next year, Shalimar has budgeted...

Related questions
Question
100%
Transcribed Image Text:In preparation for a new season, a buyer determined a 58% initial markup was required for
total purchases for the season in order to meet her gross margin goal of 50%. Her total budget
for purchases was $1,923,000 at retail.
Upon completion of purchase orders with all vendors, the buyer reviewed all purchases, which
amounted to $807,660 at billed cost.
At the end of the season, a vendor analysis was conducted to evaluate the purchase versus sales
performance of each vendor's merchandise. The analysis revealed the purchase and sales results
shown below:
Original Retail
$87,000
102,000
94,000
98,000
179,000
162,000
235,000
250,000
130,000
187,000
201,000
198,000
1,923,000
Vendor
Billed Cost
Net Sales
Vendor A
$86,270
$38,520
43,270
41,270
42,230
74,200
98,420
77,720
81,660
155,750
149,940
199,870
203,800
108,990
137,780
170,980
181,850
1,653,030
Vendor B
Vendor C
Vendor D
Vendor E
68,030
96,990
101,280
52,270
75,320
83,260
91,020
807,660
Vendor F
Vendor G
Vendor H
Vendor I
Vendor J
Vendor K
Vendor L
Total
1. On a spreadsheet, type in the information given in the above table (Row and column
headings look exactly like the above).
2. Add 3 columns to the right side of the above spreadsheet to show the following numbers (a)
through (c).
(a) Initial markup% planned for each vendor and total.
(b) Maintained markup% achieved for each vendor and total.
(c) Reductions% applied to each vendor's merchandise as well as total merchandise.
3. Type in appropriate headings, and compute figures in the added columns using formulas.
4. Format spreadsheet numbers as follows.
Format dollar figures to Currency $, 0 decimal places
Format percentages to %, 2 decimal places
Expert Solution
Step 1
Introduction:-
In order to fulfil her 50 percent gross margin objective, the buyer concluded that a 58 percent beginning markup was necessary for total purchases for the season. Her overall retail buying budget was $1,923,000. The buyer examined all purchases, which totaled $807,660 at invoiced cost, after completing purchase orders with all suppliers. A vendor study was undertaken at the conclusion of the season to examine the buy versus sales performance of each vendor's product.

Trending now
This is a popular solution!

Step by step
Solved in 2 steps

Knowledge Booster


Learn more about
Need a deep-dive on the concept behind this application? Look no further. Learn more about this topic, accounting and related others by exploring similar questions and additional content below.Recommended textbooks for you
Cornerstones of Cost Management (Cornerstones Ser…
Accounting
ISBN:
9781305970663
Author:
Don R. Hansen, Maryanne M. Mowen
Publisher:
Cengage Learning

EBK CONTEMPORARY FINANCIAL MANAGEMENT
Finance
ISBN:
9781337514835
Author:
MOYER
Publisher:
CENGAGE LEARNING - CONSIGNMENT

Managerial Accounting: The Cornerstone of Busines…
Accounting
ISBN:
9781337115773
Author:
Maryanne M. Mowen, Don R. Hansen, Dan L. Heitger
Publisher:
Cengage Learning
Cornerstones of Cost Management (Cornerstones Ser…
Accounting
ISBN:
9781305970663
Author:
Don R. Hansen, Maryanne M. Mowen
Publisher:
Cengage Learning
EBK CONTEMPORARY FINANCIAL MANAGEMENT
Finance
ISBN:
9781337514835
Author:
MOYER
Publisher:
CENGAGE LEARNING - CONSIGNMENT
Managerial Accounting: The Cornerstone of Busines…
Accounting
ISBN:
9781337115773
Author:
Maryanne M. Mowen, Don R. Hansen, Dan L. Heitger
Publisher:
Cengage Learning

Principles of Cost Accounting
Accounting
ISBN:
9781305087408
Author:
Edward J. Vanderbeck, Maria R. Mitchell
Publisher:
Cengage Learning

Excel Applications for Accounting Principles
Accounting
ISBN:
9781111581565
Author:
Gaylord N. Smith
Publisher:
Cengage Learning

Principles of Accounting Volume 2
Accounting
ISBN:
9781947172609
Author:
OpenStax
Publisher:
OpenStax College